
There is a theory which states that if ever anyone discovers exactly what the CUR is for and why it is here, it will instantly disappear and be replaced by something even more bizarre and inexplicable. There is another theory mentioned, which states that this has already happened.
(with apologies to Douglas Adams)
Compared to this blog’s previous post, things will get more technical in the second part of this entry. This deep-dive is somewhat necessary to set up some of the technical aspects of solutioneering for problem spaces we’ll cover in the blog’s future like amortization, rate-blending and chargebacks/allocations.
PART 1
In the first part are three high-level subjects to consider-
1. Is looking at the CUR right for me?
The CUR is one of the most lethal double-edge swords you can wield in managing and optimizing your cloud. There are a great number of gnarly problems you just can’t solve any other way. For the problems where there are other solutions, mastery of the CUR will enable results which are more precise, thorough, and timely than possible by any other approach. This is because whether you’re using Amazon’s own Cost Explorer, a SaaS-based cloud management company, or one of any number of open-source reporting utilities, underneath the covers, the CUR is the primary data source forming the data backbone of each. By depending on others’ solutions, you’re beholden to their timelines, and to how they’ve each decided to interpret and present the same underlying truth. Instead of bending the cloud to suit your business, you’ll be bending your business to fit your chosen cloud-bill interpreter.
At the same time, making the CUR part of your solution set is a path fraught with peril, and isn’t the right choice for everyone. Success or failure in the effort is dependent on how well you are able to insulate your end users from the gaps, inconsistencies, and constant stream of changes inherent within AWS. To solve a persistent and mission-critical business need through independent CUR processing is to hang a sword of Damocles over your team. A circumstance where you’ll find the collective professional aspiration of the Product Manager army representing Amazon’s 200+ services – while maybe not to intentionally harm you – is to introduce the most change possible, every headline an arrow sent towards the thread by which it hangs.
As someone responsible for cloud cost management for your organization, it’s important to recognize if and when it’s time for your organization to take this on. Many fail to even consider it an option, long past the point in their cloud journey where it could have provided great benefit. When not having the critical insights needed to make key decisions (including managing RIs and Savings Plans to a high level of excellence) costs orders of magnitude more than a couple data engineers, it might be time to get started. Just know that other than this blog post, there is no guidebook out there on how to do it – you’re on your own.
2. The AWS Business and Billing Model
Business
When dealing with the CUR but also AWS in general, it can be helpful to not think of it as a single company – instead, think of it as “The United Services of AWS”. As of this writing, AWS has 212 active services – every one a member state of the larger AWS nation. Each has its own leader, who – like a state’s governor in the early days of the USA – is empowered with tremendous autonomy to achieve their business objectives. This dynamic will come into play later when we talk about EDP and negotiating with Amazon, but for now it’s important to understanding the maelstrom that is your billing data.
The biggest features and fixes AWS cranks out are put together by laser-focused two-pizza teams within those individual service organizations. Groups that small aren’t equipped to comprehensively assess the impact of their activities outside of their service – especially (but not limited to) non-revenue-generating services like Cost Explorer. This is why – if you’re watching closely – you’ll regularly see a new technical feature completely break something in Cost Explorer, or launch with its critical business-management counterpart capabilities lacking or completely absent.
Highly distributed autonomy allows AWS to move with an extraordinary speed and agility their competitors cannot match. Every one of those two-pizza teams is sprinting through the bare minimum of red tape to deliver for their customers. For enterprise-scale customers however, there are downsides* to this approach. There can be a lack of consistency across the AWS nation in how problems are solved. As a customer, many more relationships end up needing to be established and maintained to ensure the pressure of your dissatisfaction is landing on the right throats.
*As with everything Amazon, they are self-aware enough to remain mindful of these shortcomings and continuously work to mitigate them without sacrificing their trademark speed. In the years I’ve been dealing with AWS, the Cost Explorer team, the TAMs, and our actual billing data, all have made great strides in becoming more enterprise-friendly. Still, “No compression algorithm for experience” cuts both ways and Microsoft’s decade-plus head start in servicing enterprises cannot be overlooked as a plus for Azure.
Billing
Every AWS service meters your usage just like usage of utilities is metered in your home. It can be helpful to visualize your usage of cloud resources like having a light on or running the faucet. The higher wattage that bulb, the bigger that faucet, and the longer they’re on, the more electricity and water you’ll consume, and the more it’ll cost.
Some AWS services can be described using only a few simple meters, just like a home (water, gas, electricity). Others require dozens of meters, and for a monster like EC2, there are at least several thousand different types of meters you can spin with your usage.

In AWS, most services report meter readings every hour (some, like S3, only once per day). This raw meter data is sent from the utilized service in to the central Cost Explorer group. This group looks up the appropriate rates for every different type of meter and multiplies it by the usage amount, to determine the cost for that type of usage for that hour. It then decorates the usage with relevant tags and other metadata needed to flesh out each line of your CUR. From there, the CUR is published out to S3 per your specifications.
Each CUR is a restatement of the entire month-to-date. Doing it this way, instead of an incremental feed, allows AWS to repair anything that might have gone wrong in a previous hour. Remember, everything you see is an estimate until the month is fully closed out.
All of this can be quite a bit of data – to illustrate, the author’s personal/home AWS account generates under $40/month in spend, utilizing fewer than 10 AWS services. However, it takes about 60,000 rows of data to describe the charges incurred by this tiny account over one month. Per hour, that’s about 80 rows of data to describe $.05 worth of use. While this ratio won’t hold in all cases, if we apply it to AWS’s first $10B quarter, 1600 rows per $ of revenue it maps to over 5 trillion rows of billing data available to customers each month. I wonder what fraction of that is being analyzed in much detail?
The core action performed by the Cost Explorer group above – attaching a rate to a usage meter, is what I consider the first principle of cloud spend:
Cost = Rate x Usage
Expressed geometrically, your Cost is a rectangle whose area is the product of sides Rate and Usage-
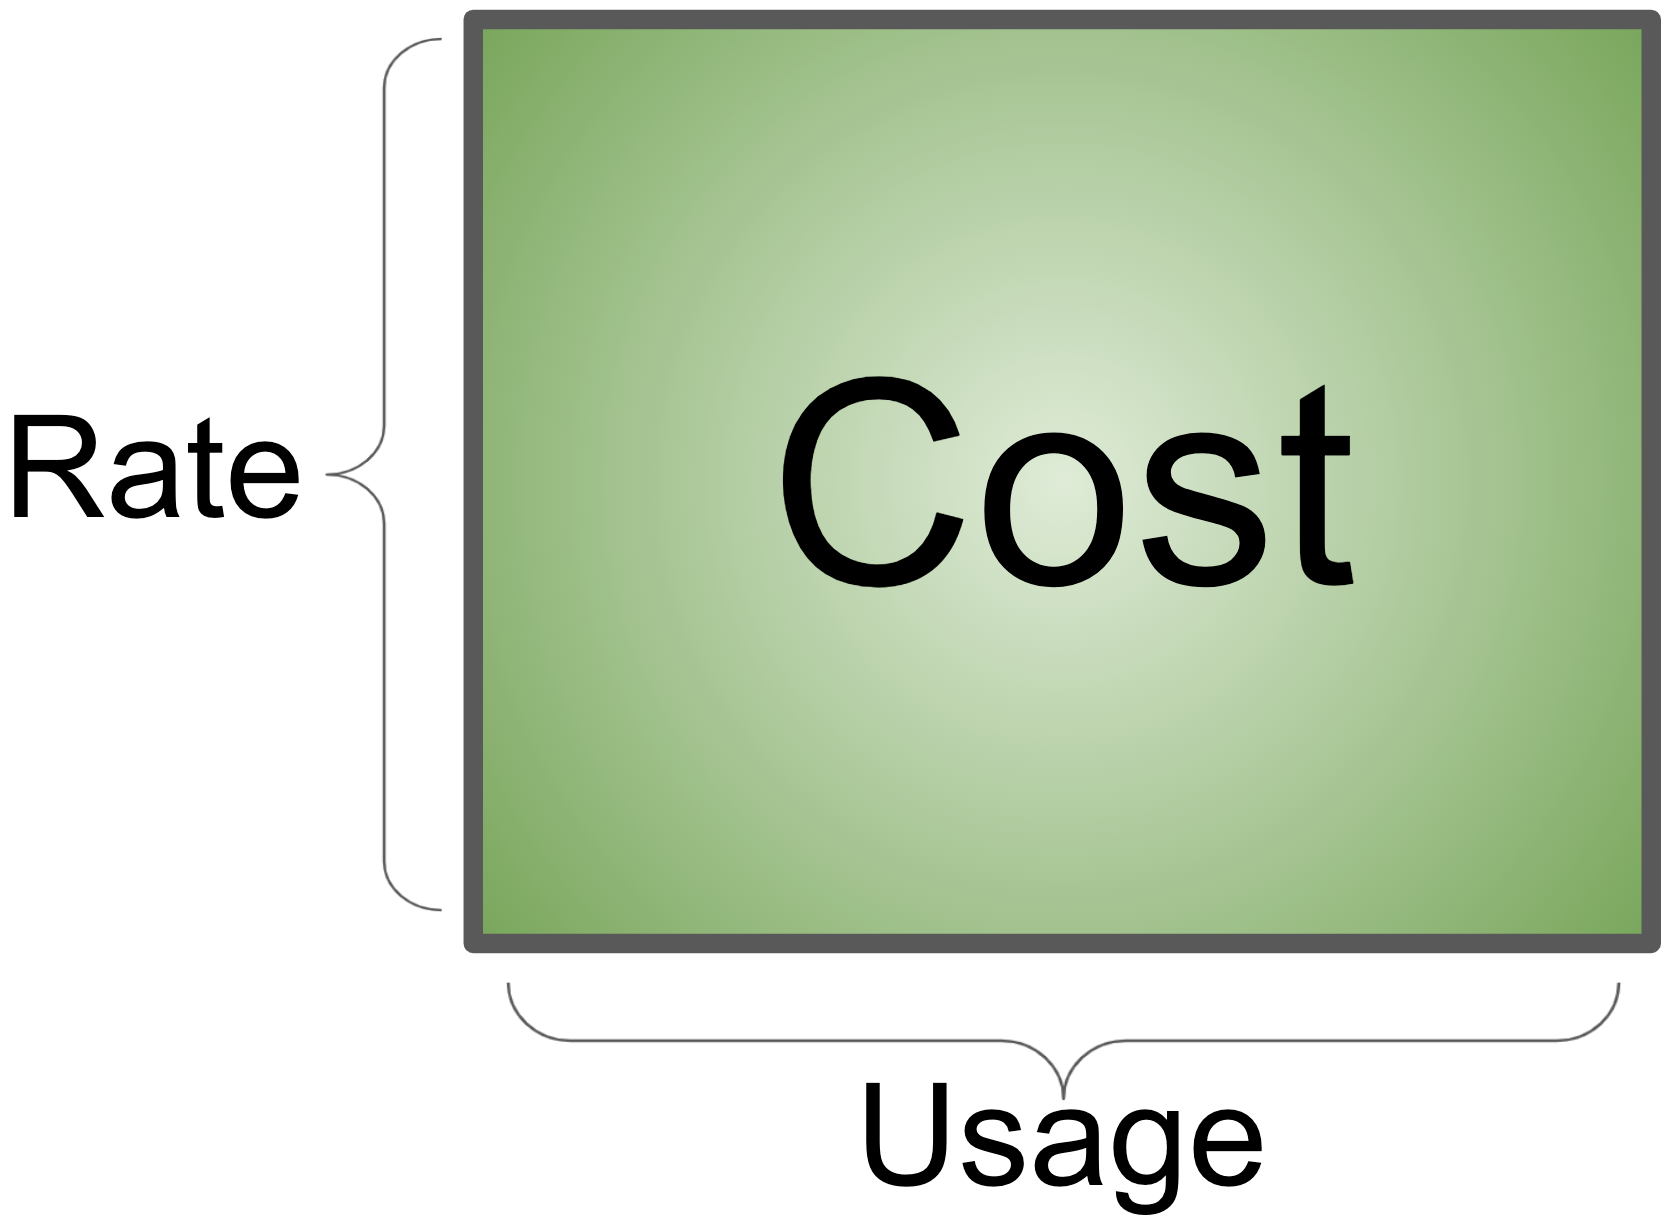
Everything you do to optimize your organization’s cloud spend, is done by either reducing the rate paid, or by reducing the usage amount. With as highly technical as some cost-opt discussions can get, it’s important to not lose this footing.
It is too easy to get fixated on shrinking one side of the rectangle, paying too little attention to the other. In my experience the background of the person or team heading cost optimization predicts the focus area – Finance types tend to focus on rate-reducing activities, while technical Cloud types tend to focus on usage-reducing activities. As you might imagine, the best results will tend to come from a balanced evaluation of the opportunity space, which is only possible if the team working on it is itself well balanced.
3. Is AWS Overcharging Me?
Maybe, but unless you can read your CUR, how would you know? 😉
In reality, the answer to this question is “Probably not and if so, not only is it not on purpose, they’re just as likely to be shortchanging themselves”. In my experience, the AWS CUR is a very high quality data source when dealing with normal billing situations. What you get is much more reliable, comprehensive, and trustworthy than anything your internal IT department could ever generate. While this may not sound surprising, I find it a stark and refreshing contrast with the telecom industry, where intentional, systemic overcharging and obfuscation have been the norm for decades.
The place to be extra vigilant is where any sort of special arrangement has been made with AWS, especially where there are manual steps in implementation. The circumstances of how such an arrangement could come to be will be covered in greater – though certainly not NDA-violating! – detail later, but for now, if you’re worried something isn’t right in your bill, the place to look is everywhere any sort of special deal has been made, to ensure it’s been implemented correctly.
For all the technology and sophistication, AWS is still run by human beings, none of whom are infallible. So, if you’re worried about being overcharged and have some cycles to actually investigate, focus first on the areas where somebody at some point, had to manually provide input to a process that would otherwise have been fully automated. This same common-sense principle really ought to be applied to the review of any significant bill.
PART 2
Returning to the quote at the beginning of this post, things in AWS change at a dizzying pace, making it difficult to to comprehensively document anything. If it takes more than a few hours to write a document, you can be certain some part will have changed since you started. What follows is especially susceptible to this phenomenon.
Originally I’d intended to cover some common use cases in the use of CUR data after breaking it down, but the post ended up too long as is. Can look into this in a future post – if there are any use cases of particular interest, you can always email me the suggestion.
Breaking Down the CUR – The Assembly
As a large and complex body of information, we’ll need to take a divide-and-conquer approach to how we familiarize ourselves with it:
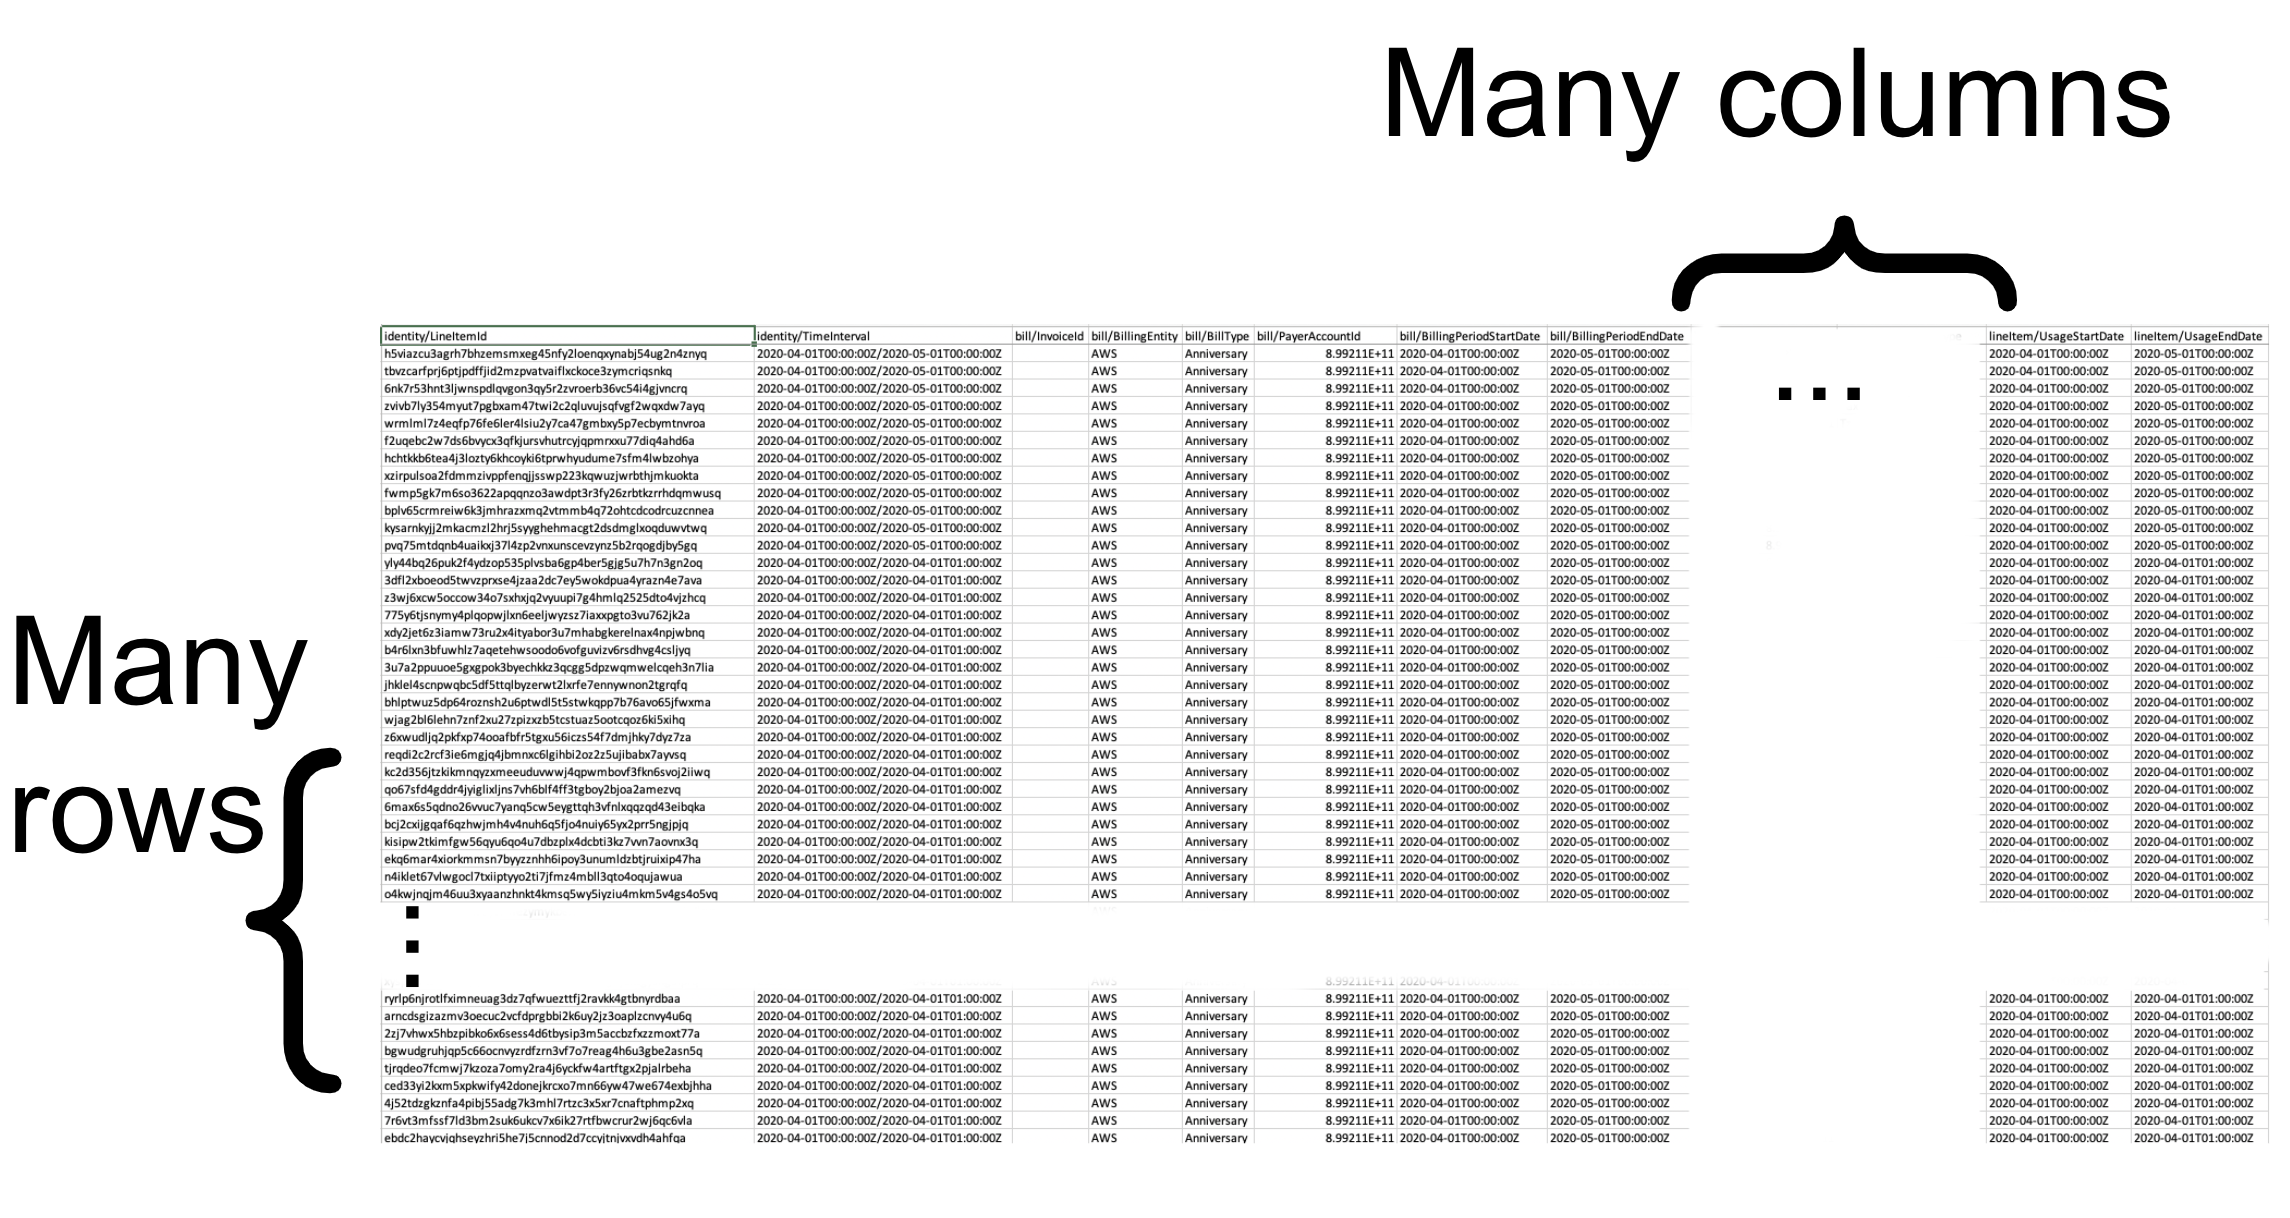
Most simply, the CUR can be thought of as a gigantic spreadsheet. If your organization is small enough, you might even be able to gain the insights you need through a few clever macros and charts. However, it is very easy for even a modest org to blow past the million-row limitation of popular spreadsheet programs. You can configure the CUR to arrive at various levels of pre-aggregation, however the focus here will be on the least aggregated (most detailed) version, the one with Resources and Tags.
When delivered to you in S3, if you choose the g-zipped CSV format, it will arrive as one or more files in what AWS calls an assembly. In a large enterprise, there may be thousands of files in one assembly. Each file’s size is capped such that when unzipped, it should be readable by Excel. The start of the first file contains the “abnormal” rows (how they are abnormal will be covered next) followed by the normal rows.

Within the assembly once normal rows begin, the first AWS account’s costs will be listed out in their entirety. BTW – if you’re not familiar with AWS Accounts and Consolidated Billing, this AWS page is a good place to start; your organization should absolutely be using consolidated billing if it isn’t already. If there’s room, things will go on to the next account, and so on – there may be several accounts whose costs are listed in one file. When a maximum amount of data has been generated, it will create the next file and continue. This may happen in the middle of the listing-out of a single account’s costs – there is no guarantee one file will contain all of the account’s costs. This is important to know if you’re trying to understand the costs of a large account using Excel – one file may not have everything, you may need the file(s) that came before or after to complete the picture.
Rows
If the rows of your CUR are the “what” of you bill, the columns contain the descriptive “how” of your cost and usage. The vast majority (a true 99.9% or more most of the time) of your rows will fit the normal pattern – for a specific hour, within a specific account, for a specific AWS Service, you consumed a specific amount of a specific type of resource, which has a cost.
The other .1% – the rows at the beginning of the first file in an assembly – are the abnormal ones. The main way to distinguish these rows is to recognize they do not cover just one clean hour of use (column lineItem/UsageStartDate does not start on an hour boundary or is not exactly one hour before lineItem/UsageEndDate)- they might cover a whole month, or even multiple month spans. Here are the sorts of things that show up in here – this is from memory and by no means exhaustive:
- Reserved Instance and Savings Plan purchases
- Credits and refunds
- Taxes
- Domain name registrations
- Enterprise support
- Weird costs (the possibilities are endless!)
As we’ll see later when talking through amortization and allocations, the way these rows need to be handled will differ from the 99.9%ers. For the discussion on CUR columns to follow, the context is for normal rows. Abnormal rows share the same schema, but tend to be loaded differently – you can tell the AWS-internal teams trying to fit their data in encountered many square-peg-round-hole scenarios and just did the best they could.
Columns
Amazon provides a data dictionary for the CUR, which includes a link to a ZIP file containing a listing of the (as of this writing) 5277 possible column/service combinations.
The fields/columns of the CUR are broken up by subject area, AWS calls Topics:
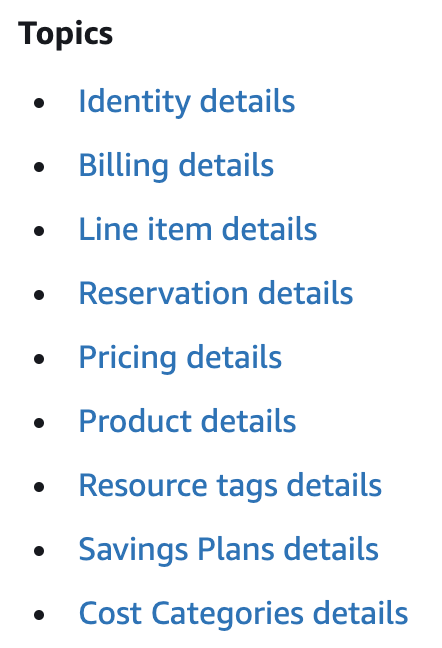
When I first looked at the CUR I think there were only 6 topics, there are now 9. By the time you read this, it may be well into double digits.
Each topic contains a collection of columns. There are way too many to go into detail on each; instead I’ll provide some commentary on the most important ones.
Identity
identity/LineItemId – Everybody who first looks at the CUR sees this and thinks “Ahh good we can use this to make processing of the CUR an incremental process, and maybe we should use it as a primary key.” Unfortunately here these instincts betray their holder, as neither work. First, the LineItemIds are not kept constant between CURs – they are all new each time. Second, they are not even unique within a CUR – they are *usually* unique within an hour within a CUR, but even then, not always. This field ends up being mostly useless.
Billing
Nothing here of terrible interest. Certain costs will be split out into separate sub-“bills” but costs are costs.
Line Item
This is where all the best stuff is, and where most of your attention should go. For those who have been around since the days of the DBR (the billing artifact predating the CUR), most of what’s in LineItem is a carryover of the DBR’s 20-ish fixed fields.
lineItem/UsageStartDate – As we talked about in the Rows section, for 99.9% of your data, this will be a clean hour start, with the matching UsageEndDate exactly one hour later. This describes the hour where the usage row occurred. For any large enterprise where you have a lot of data, and especially if you have the capability to query across months, you’ll want to scope your examination to a narrow range of UsageStartDate(s). This column makes a great candidate as a physical sort key if you’re warehousing the data.
lineItem/UsageAccountId – The AWS account performing the usage. While a fairly simple concept, this field ends up providing for a powerful boundary between costs in your cloud.
lineItem/ProductCode – The AWS Service (EC2, RDS, S3, etc.) within which the usage and cost occurred. You’ll see the same service referred to by slightly different names (“AmazonEC2” here, “Amazon Elastic Compute Cloud” over there) in other columns, but this one is generally suitable for reporting. Also of note, some versions of the CUR or other cost reporting which are more aggregated have costs rolled up differently. For instance, in the detailed CUR you’ll see a lot of networking charges incurred in the context of the EC2 service, but in their more aggregated reports these are moved to a “Data Transfer” service.
lineItem/Operation and lineItem/UsageType – Batman and Robin, Riggs and Murtaugh, Lilo and Stitch, Rick and Morty, Bebop and Rocksteady – these are your favorite dynamic duo providing technical insight into the usage. When it comes to understanding the nature of one’s baseline and changes in cost and usage, these are the two most important columns in the CUR.
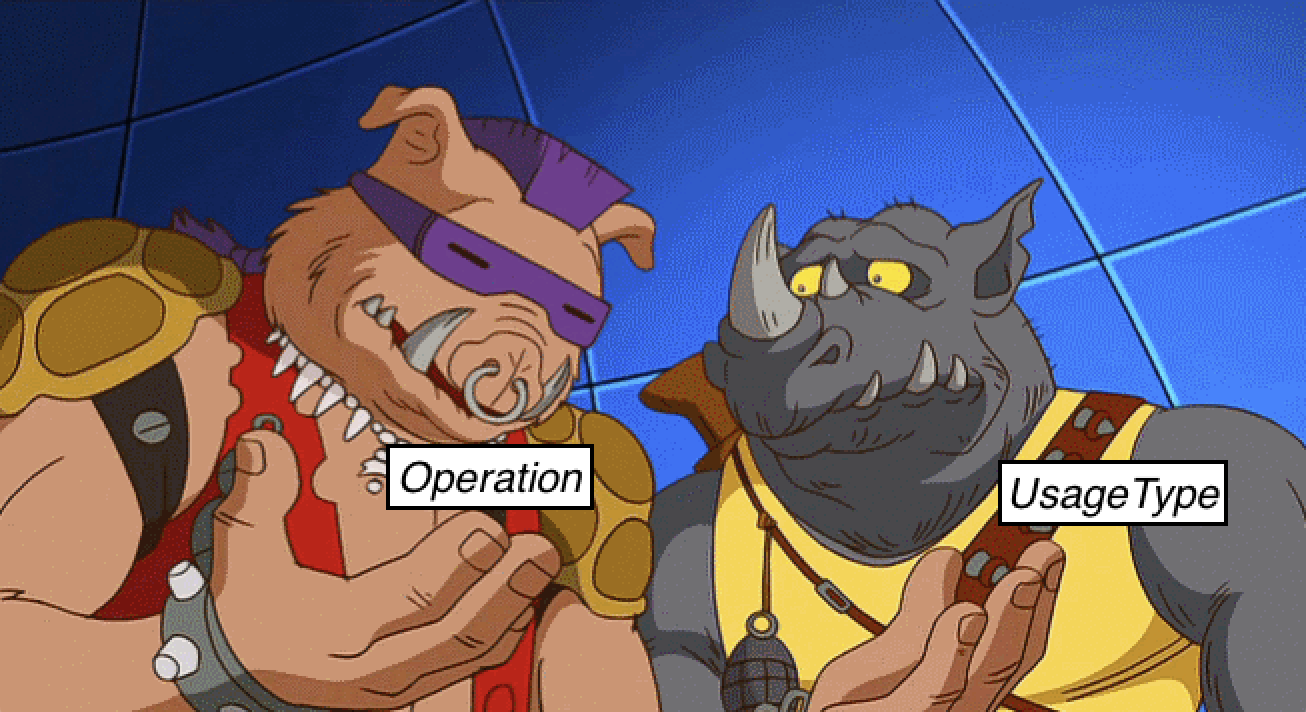
Which of the two will provide the more valuable clue in any given circumstance is not a given. I tend to think of UsageType as a drill-down of Operation (where you’d drill down from lineitem ProductCode -> Operation -> UsageType for increasing detail), but it doesn’t always work that way. When people come to you asking “why have my costs gone up?”, the answer is almost always due to in increase in some type of usage (“because you tripled your use of EBS storage in the us-east-2 region”) – and these are the columns which tell the tale.
These columns are of particular interest when it comes to gaining a better understanding of your use of instances. For most organizations, the use of instances (EC2 boxes, RDS databases, Redshift clusters, etc.) comprise the majority of costs. Yet, from the CUR’s perspective, they tend to comprise a small fraction of the data. You may find >75% of your costs are represented by <5% of the rows in your bill. As such, it may make sense to gain a deeper understanding of those instance rows, to understand all their nuanced characteristics. Things like the region, instance type, tenancy, operating system, pre installed software, licensing model – and that’s just for EC2. Thoroughly understanding your instance fleet will be a necessity later when we talk about Reserved Instances and Savings Plans.
Side note: AWS must have once thought Virginia (aka US-East-1) would be their only region. The UsageType field is generally formatted as [region abbreviation]-[UsageType] - except when the usage is in Virginia. The absence of a region means US-East-1, but it also means instead of being able to reliably split the string on the first hyphen and take what's to the left as a region code, you need to stay on your toes.

Side note 2: Ditto m1.small as the "default" instance type. A normal UsageType line for an EC2 instance might look like:
USW2-BoxUsage:t3.medium
But for an m1.small in US-East-1, you'll see:
BoxUsage

Fun eh?
Unfortunately, none of the instance characteristics are natural columns in the CUR – they all have to be derived from Operation and UsageType. Effectively, these columns are “overloaded” in that they have to carry 10 fields’ worth of data in those two columns. To fill-in the picture, you need to parse and decode these two fields to populate all the different fields needed to fully describe your instances.
Doing this entails decoding some secret-feeling codes in the Operation field. If you dig, there are some clues out there on how to decode this, but none of the info you need to reliably unscramble the AWS cipher is available programmatically. Good luck code breakers!
lineItem/LineItemDescription – An attempt to describe the usage in plainer english than the operation and usagetype codes. This column tends to not introduce much if any additional cardinality to the data, but it can be handy in accompanying the dynamic duo in helping to better understand the nature of the cost.
lineItem/UsageAmount – How much you used. This is a numeric value which only tends to make sense in light of the LineItemDescription. A common mistake I see people making is trying to sum this value across a service like S3. There, you’re charged a couple cents per GB-month for storage, but for other things like GETs, you’re charged 4 cents per 100,000 GETs. So you might have tens of millions of GETs in a month but only a couple hundred thousand GB-months of storage. Big changes in GETs have a small effect on the bill, where small changes in GB-months of storage have a relatively large effect. Aggregating UsageAmount across different usage types is like mixing milk and orange juice – yuck!
lineItem/UnblendedCost – This is the most raw view of what AWS thinks this bit of usage cost. It is restated in various ways, but those are all some interpretation of this base value. AWS provides this as the result of the calculation:
UnblendedCost = UnblendedRate * UsageAmount
Which should look familiar, it’s our first principle of cloud cost from the first half.
lineitem/ResourceId – while not always populated, the ability to reference this column is one of the most powerful capabilities of the CUR. It allows you to understand the size/usage and cost of individual items in the fleet. This is where you can find the answer to questions of the form “what is this specific [s3 bucket or RDS DB or Dynamo Table] costing me?”. This level of detail is not present even in Amazon’s own Cost Explorer reporting tools.
AWS provides a partial list of resource types by service. There are many more than this listing, you’ll have to explore each service to understand the level of detail in tracking.
| AWS Service | Resource Identifier |
|---|---|
| Amazon CloudFront | Distribution ID |
| Amazon CloudSearch | Search domain |
| Amazon DynamoDB | DynamoDB table |
| Amazon Elastic Compute Cloud – Amazon EBS | Amazon EBS volume |
| Amazon Elastic Compute Cloud | Instance ID |
| Amazon Elastic Compute Cloud – CloudWatch | CloudWatch charges for an instance ID |
| Amazon EMR | MapReduce cluster |
| Amazon ElastiCache | Cache cluster |
| Amazon Elasticsearch Service | Search domain |
| Amazon S3 Glacier | Vault |
| Amazon Relational Database Service | Database |
| Amazon Redshift | Amazon Redshift cluster |
| Amazon Simple Storage Service | Amazon S3 bucket |
| Amazon Virtual Private Cloud | VPN ID |
| AWS Lambda | Lambda function name |
Having the ResourceId is part of why the CUR has so many rows. The collection of S3 buckets in an account might only generate 10 different types of charges in a day. But if you have 40 buckets in the account, the amount of cost and usage for each bucket is tracked, so the number of data rows is multiplied 40x. The same is true for every other resource type.
Of note, I’ve often been asked for the cost of individual objects in S3. Were AWS to bill at the S3 object level, we might see trillion-row CUR files, as it’s not hard to end up with millions or even billions of S3 objects. If this path of inquiry can’t be dismissed in your situation, AWS offers the S3 Inventory service if you want to get down into the Quantum Realm of your bill.
Reservation
A collection of fields relating to the application of Reserved Instances.
reservation/ReservationARN – Useful when trying to understand where you have RI waste and outstanding savings opportunities. RIs are slowly being phased out by Savings Plans.
Pricing
pricing/publicOnDemandCost – this one is interesting to track and preserve if you end up doing any rate manipulations. Think of it as the “retail price” of what got used. This might be helpful later in calculating realized savings. pricing/publicOnDemandCost – {my net cost} = my savings.
Product
This is perhaps the most dangerous collection of columns within the CUR. Depending on which services you use, there may be several hundred fields. Wield them at your own risk! At first glance the content here looks rich and appealing, especially for those coming from the previous DBR product. Comprehensive details about the products in use, in theory relieving analysts of the burden of having to research this information and marry it to the usage independently.

Unfortunately, these columns tend to be very sporadically populated. Some may be populated “most of” the time, but what are you going to do when they aren’t? Or when AWS decides a column that since forever has only ever been null or held integers, should start holding ‘N/A’. In my experience these columns are not dependable enough to be of regular use in downstream analysis and calculation. Only use this data if it can’t be obtained from a more reliable source.
Resource tags
Ahh, tagging. There are two classes of tags that’ll come through here –
resourceTags/aws:[tag key]
resourceTags/user:[tag key]
Tagging is a deep subject worthy of a post by itself, which will come later when we talk cloud attribution. These columns are where your hard work in applying tags pays off – the resources you’ve so diligently tagged, will see the values populated in their tag key columns. Except for that very long list of oft-expensive untag-able things. Uh oh!
I see tags best used as a last line of defense in attribution, where much industry literature shows people using it as the end-all, be-all. More on this to come.
Savings Plans
Similar to the Reservation field set.
savingsPlan/SavingsPlanArn – tells you which Savings Plan was applied where. Amazon provides a couple other columns where they’ve “helped you” by doing a number of savings calculations. My advice is to lean on the CUR for the core/raw “essential nutrients” of what happened and to perform the calculations yourself.
Cost Categories
A very recent add – Cost Categories didn’t even exist when the blog was first started. Third party Cloud Cost Mgt companies saw the need for this capability years ago so it’s not a new concept.
Concluding Thoughts and War Stories
The decision to make the CUR a core part of your organization’s cloud business management function is not one to be made lightly. Done well, it can enable a depth of comprehension to your cloud operation AWS and third party tools can’t match. Done anything less than really well, and the choice may be career-limiting.
I often hear stories from peers with scary bits like
"...and then when AWS released Savings Plans all our custom reporting was broken for 3 months..."
Similar horror stories when EC2 switched to per-second billing, when Convertible RIs were released, in implementation of On Demand Capacity Reservations (ODCRs), and so on.
Getting a basic pipeline stood up to provide insight is one thing – keeping it accurate and relevant against the flood of Amazon product activity, is another. If you are successful, you’ll be able to steer your org in the right direction much more deftly than those who are stuck waiting months for AWS or third parties to update their reporting software to reflect the new state. At scale, those quick pivots can pay for years of your cost opt team’s salary. At the same time, it allows your organization to bend its cloud data to the shape of its business, instead of feeling forced to shift its business to fit others’ limited cloud management paradigms.

Much of the last 4+ years of my career has been spent writing programs to fill gaps in the CUR so people and processes could make sense of what happened in their cloud. Then completely changing those programs when AWS changed how they do things with no warning and for no apparent reason. Staying on top of the mission of bill interpretation is a full time job – and Amazon’s pace of change is only accelerating.
Still, in light of what’s happening to the world economy and what it probably means to your own organization, there may never be a better time to get started.