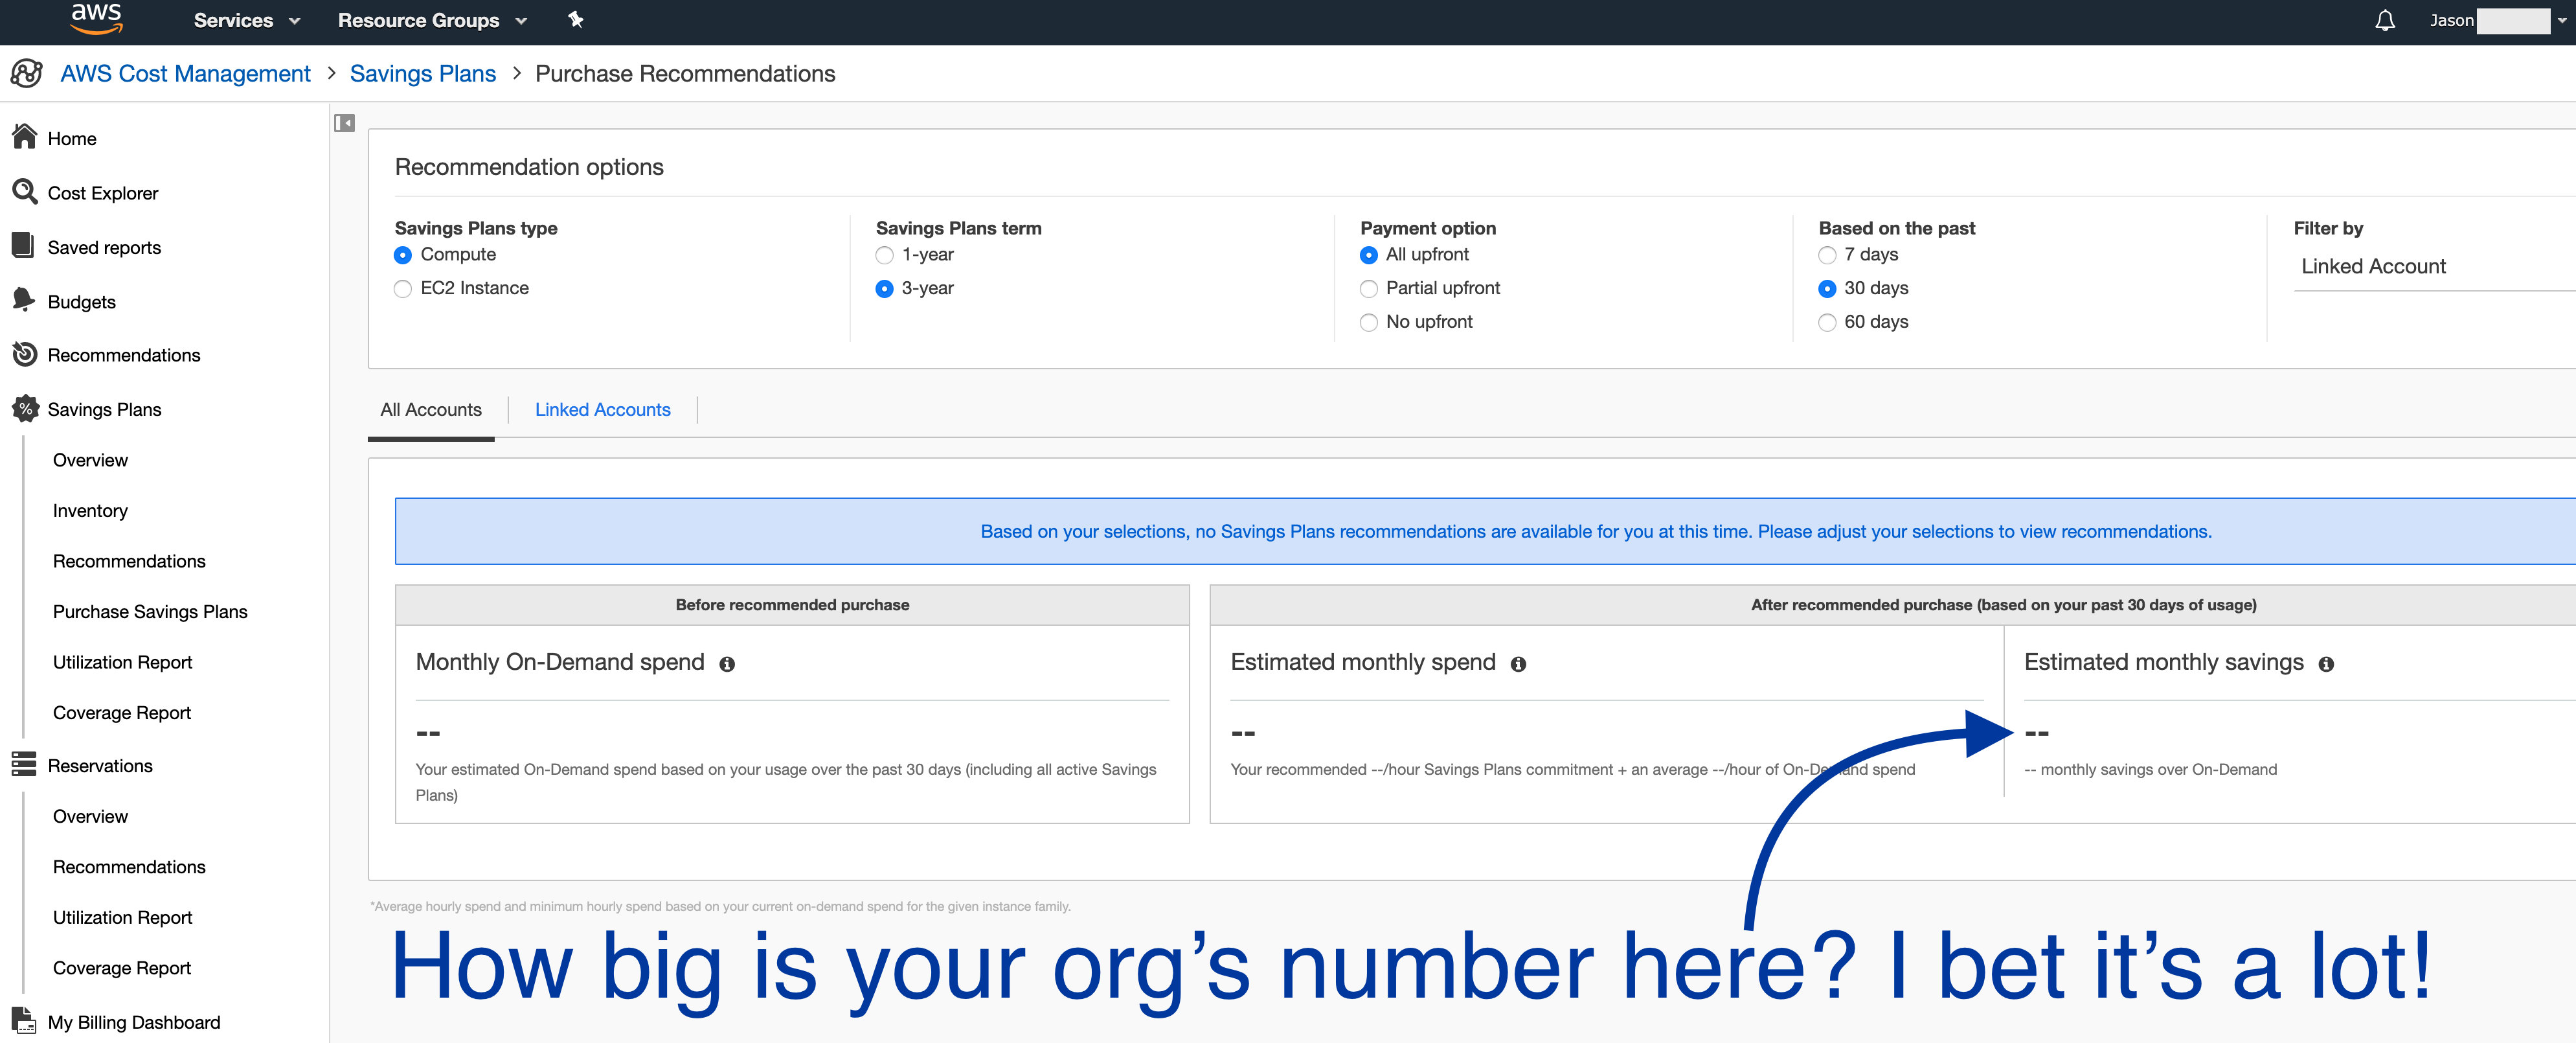
During a discussion in the FinOps Foundation‘s (seriously, haven’t you joined yet?) Slack space, fellow practitioner Mike Bradbury had some good questions about getting engineers to act on cost optimization.
Pinning a number on the expected gain from cost optimisation recommendations is an interesting idea and could certainly make it easier to compare the value of competing priorities. … Do you envisage a process in which ‘quantified’ cost optimisation recommendations are submitted to engineering leadership who then weigh the effort/value against similarly quantified alternative actions and select those that will be actioned and those that will not?
I wonder if cost optimisation should be thought of as ‘good housekeeping’ rather than an initiative to be compared with other competing priorities? … Should we be thinking of cost optimisation as simply ‘good housekeeping’ that should happen no matter what?
Mike Bradbury, Director @ Juno Services
Q1
First question first – how do we communicate optimization recommendations to engineering? Here I feel the answer depends on the size and makeup of the organization but the simple version is “in whatever way gets them to act best”.
For a small shop, and one where things are fairly static, the landscape of opportunities is not likely to change very fast. In this situation, it might make sense to distill down the observed recommendations to a manageable set, and to register them as backlog story items in the appropriate engineering team’s queue.
However my experience is in a large organization with several thousand developers spread across hundreds of development teams, and a large and highly dynamic cloud. At this scale, when you are examining a gigantic cloud along dozens of optimization patterns, you will find tens or hundreds of thousands of individual opportunities, with thousands coming and going each day. Flooding teams’ JIRA queues with those at the line level would be a quick way to get cost optimization uninvited from the engineering priority list.
Instead, what I’ve found works is to provide tooling allowing each dev team to see and understand their opportunity set along a variety of data dimensions. These include things like the type of waste (underutilized EC2 instances, orphaned EBS volumes, misconfigured S3 buckets, etc.), accounts, tags, related business dimensions, opportunity value, and of course, time. Even as the individual opportunity sets ebb and flow day by day, teams can zoom out to see how their actions have had net positive or negative impact to their waste profile.
As covered in Step 8 of the Waste Management post from this blog, it helps to communicate overall waste in context of the group’s spend. A team observed wasting $50k/mo with $500k/mo spend might be considered in poor shape (10% spend as waste); but if that team’s business has grown fast and now they’re spending $2M/mo but still wasting $50k/mo (2.5% spend as waste), we’d probably consider them in much better shape.
Dashboards aren’t a bad way to start and will always have use for rolled-up executive visibility. As your audience gets larger, you should expect to need to deliver information upon an ever-broadening set of channels to best align with internal customer needs. You might need to offer up the data via API, scheduled or event-driven delivery over email or IM or SMS, raw data exports for downstream analysis, maybe even complete Jupyter notebooks. The more you are able to flex in getting data to people, the less everyone else will have to flex to get it, and the more likely they will be to take action.
This extends into management space; some teams may have cycles to absorb cloud optimization as part of their routine – others may not. For teams that don’t, the center cost opt team may need to provide supplementary program management style assistance. This might take the shape of helping a group establish a taxonomy for organizing their corner of the organization’s cloud, attributing the right bits to the right people and teams, and teaching them how to prioritize their observed opportunities against competing business pressures.
Q2
Second, should we think of engineering-based cost optimization as “Good Housekeeping”, or as a set of discrete Initiatives? The short but not very helpful answer is: both.
To help illustrate efforts of both types, let’s use some examples. A simple Housekeeping example – orphaned resources left around after migration to a new technology. Maybe a set of RDS instances were fused together into a new Redshift data warehouse. The old instances were left running but are no longer in use. Here, the team need only terminate those instances (actions which should have been part of the original Redshift migration plan), and the issue is permanently resolved.
Another example is unattached EBS volumes. For the longest time (may still be the case) – when an EC2 instance was terminated, the default behavior was to not release its associated EBS data volume. With as frequently as deployments and re-stackings can occur, a team could unwittingly generate dozens or hundreds of orphaned volumes almost overnight. Resolving this pattern requires not only cleaning up the pool of already-orphaned volumes, but updating the source code responsible for the incomplete cleanup, amending it to cease generating new orphans.
The latter case – where code regularly generates new orphan or sub-optimal resources – is unfortunately the more common of the housekeeping variants. It’s also the reason why tools like Cloud Custodian (or other tools changing the runtime environment) have limitations when it comes to enforcing cost optimization.
Cloud Custodian and tools like it can address the wasteful resources as it sees them, but it’s essentially playing a game of “Cloud Whac-a-Mole“. One where the Moles never stop coming, and where every action they take is an additional element of configuration drift between the team’s original code and their true runtime environment.
If you’re playing Cloud Cost Whac-A-Mole, good luck getting high score!
The right solve for these situations is to identify and remediate the source code causing the creation of new waste. In some cases it may just take one line of code to fix; in others it may require extensive re-factoring, placing remediation at a higher “Initiative” level of effort as described next.
The first example I’ll give for Initiative-based cost optimization, might look exactly like the first Good Housekeeping example above: a set of unused RDS instances. Maybe in this case though, investigation into their disuse reveals they are intentionally on standby, as they’re the failover nodes in a multi-region DR (Disaster Recovery) strategy.
Now, maybe for your business this is acceptable. In that case, the right thing to do might be to allow for this waste, and to mask it from the set of actionable opportunities through a workflow-based exception process (see step 10 from the previous blog entry). In other situations, this might be seen as a cop-out, masking a shortcoming in the underlying application. Maybe the right thing to do, if the application needs multi-region fault tolerance, is to insist the engineering team work to make their application function in an active-active mode across regions. This way all resources would be utilized at all times.
This waste isn’t the result of sloppiness or bad code; it’s the result of a conscious decision based on limitations of current application architecture. For applications writing to a central database, refactoring for multi-region active-active can be a major undertaking – a big Initiative.
Side note: while I take care to not get too cloud-technical in this blog, AWS’s outward stance on DR and availability has evolved quite a bit over time. Many still-commonly-held perspectives on best practices have become outmoded. A recent AWS whitepaper on Cloud DR goes deeper on this, and may be of use to you in lobbying for more highly cost-optimized target technical states.
Another Initiative style opportunity set might surround the availability of new tech. A recent example I can think of is Amazon’s release of Graviton2. In times like this, the cost optimization team can influence engineering behavior much like how a country’s tax code influences the behavior of its citizenry. If research indicates a new technology like Graviton can reduce the organization’s operating costs with no operational downsides, then use of an Intel- or AMD-based instance would henceforth be considered waste.
One needs to be prudent in this process. It is a non-trivial amount of work (e.g., an “Initiative”) for a mission-critical application team to fully test new instance types against their workloads before planning and executing a switch. In the case of Graviton, managed services like RDS or ElastiCache have complete feature parity and require no code changes to migrate. In this case, one might be justified in moving quickly to quantify non-Graviton RDS or ElastiCache instances as waste. However with EC2, the implications are much more complex and factor in at the software library-level. Much much more testing will be required not just for operational stability but for compliance and security measures. For EC2, it’d be more appropriate to enact a gentler timeline before classifying compatible non-Graviton instances as waste. The means by which new waste is identified and levied against teams must be fair and consider level of effort. Push too hard, and the citizenry will revolt!
What you’re likely to see if you expect your enterprise to adopt Graviton in less than 3 months
Conclusion
Throughout, it is imperative to enumerate and communicate the world of cost-savings opportunities to engineering teams in a manner allowing them to quickly and easily evaluate level-of-effort in attainment, comparing each to the benefit of the work. Some they can fix in a few seconds, others might take months of work. The composition of opportunities is expected to be a combination of mess they’ve left behind from prior work or bad code, a reflection of known-bad architectural choices they’ve made, and the showcasing of opportunities to reduce cost in light of new or changed technology from the cloud provider.
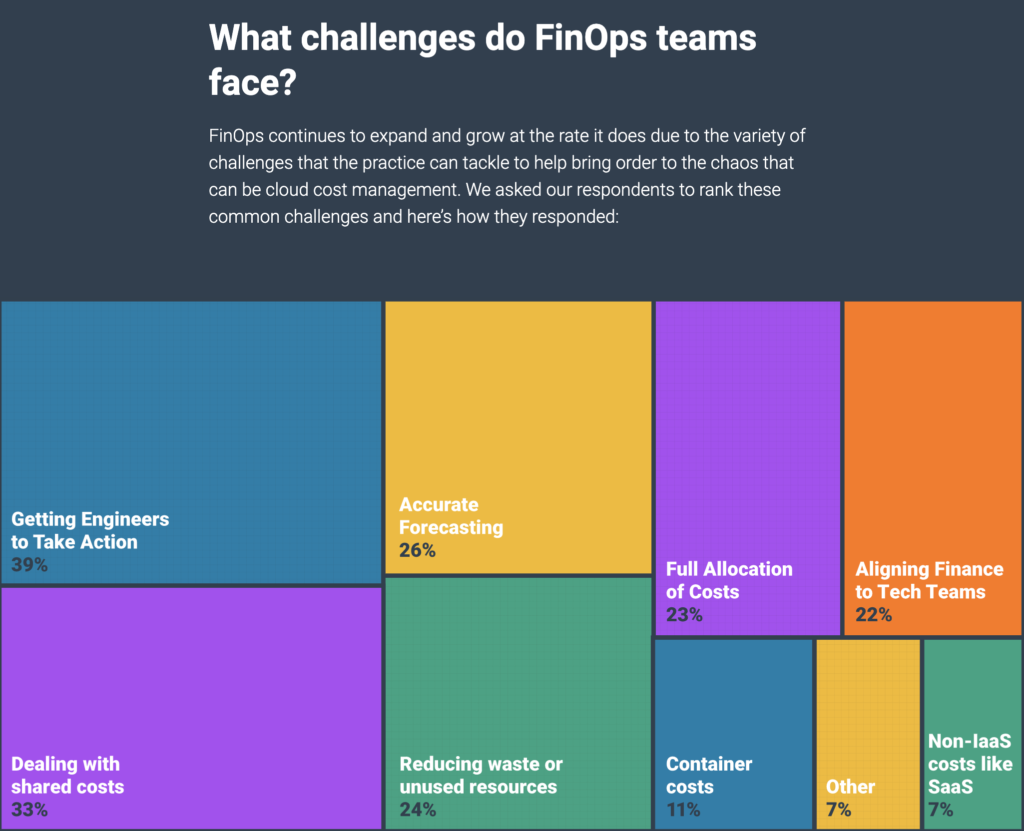
The FinOps Foundation recently released the results of a wide-scale survey of Cloud Cost practitioners around the world. If you’re reading this blog and aren’t already a member, highly recommend joining the group to benefit from a broad array of perspectives, and connect with folks who may have experience solving the problems you face.
One of the key findings from the survey – the biggest challenges surrounded “Getting Engineers to Take Action”:
In this blog’s previous entry an approach for dealing with this challenge was described. While there’s a lot of actionable content there, given the prevalence of this as a pain point in the FinOps community, I thought it might make sense to zoom out and look at how to shift perspective and quickly soothe some pain amongst my peers.
Now, it would be the rare case where we as FinOps personnel are positioned organizationally to compel engineers to prioritize cost-saving measures above their competing pressures to grow/innovate, secure, and stabilize their services. This comes back to the four competing priorities engineering groups face, mentioned in the blog’s first post:
It’s human nature to believe what one toils away at all day long is critical to the organization, but an important truth to consider is that sometimes what we’re doing – while still of huge value and importance – may not be the most important thing to the organization, in that moment. If we are responsible for cost optimization but don’t see engineers actively performing cost-saving work, does that mean we’re failing at our jobs? If so what should we do about it?
My suggestion is to not judge your success in cost optimization by the completeness of every conceivable cost-opt checklist. Instead, measure it as the organization’s knowledge and comfort of its position on efficiency – its attainment of a self-aware equilibrium of efficiency against competing business forces.
Engineering inaction in cost optimization is not necessarily a failure of the cost opt function. If the cost opt team has surfaced the universe of cost-saving opportunities, attributed them to the right dev teams, quantified them using metrics allowing for apples-to-apples comparison against competing priorities, provided concise assisted pathways to remediation, and presented a business case to engineering leadership for action – then the team is doing its job.
If there’s inaction, but engineering teams have only been given vague guidelines (“have you tried turning stuff off at night?”), no harvesting or quantification of their opportunity set has been performed so they can’t enumerate and prioritize their choices, and no guidance or help exists on how to fix things – then the cost opt team needs to look inward, as it still has work to do.
Engineering leadership is constantly adjusting the balance between the above four domains based on business climate and direction. A healthy balance exists when there’s a continuous evaluation of opportunities with action taken only on those offering suitably high ROI. In some quarters, you should expect cost opt to get little to no attention; the flip side is in quarters where the budget is tight you may find huge appetite to attack cost saving opps.
You can be certain the Security, Operations, and Product Management engineering-please-do lists are never complete, we shouldn’t expect the Cost Opt one to be there either. In fact, I’d worry about the prospects of a company choosing to fully prioritize today’s million-dollar cost savings opportunity over tomorrow’s billion-dollar blockbuster.
An alternative title to this post could be, “How to Sleep at Night as a FinOps Practitioner, Knowing Your Org is Wasting Megabucks in the Cloud” 😉
This was originally going to come after a post on maximizing savings with Reserved Instances and Savings Plans – but due to popular demand, moving it forward. This blog post is intended to equip its reader with a proven approach for measuring and driving reduction in wasteful cloud use and costs. While AWS services will be mentioned, none of the principles are specific to their cloud.
As an organization grows its cloud use – whether through migration or growth, parties involved reasonably expect costs to grow in kind. Despite this, most orgs inevitably face one or more “cost crises” on their journey – moments where costs pass certain thresholds (like the first time the cloud bill grows a new digit), or the first time costs exceed budgetary projections by a large amount. These occasions spawn fresh examinations of cloud use, seeking to “get things back under control”.
Deploying the magnifying glass reveals places where some costs contributing to the crisis could have been avoided, if only people had known about them sooner. These opportunities take the shape of orphaned or not-ideally-configured resources, which, with better and more timely remediation, could have saved the organization real money.
The all-too-common pattern is to address the surface findings of the crisis investigation, mark cloud efficiency “back on track”, and consider it done. In reality, your cloud probably had a dozen new inefficient resources provisioned before that Mission Accomplished! email even finished circulating. You need a process of continual monitoring, measurement, and remediation to ensure cloud efficiency is always on track.
Before getting deeper on this subject, a couple points. First, attribution is mandatory to succeed in a cloud waste management endeavor. You need to know who (could be a team, an org, or an individual) is responsible for the efficiency of every resource in your fleet. Resource doesn’t always mean an EC2 or other instance – it can be an S3 bucket, a DynamoDB table, an elastic IP address – there and hundreds of different types of resources available.
The next, as you go to address this space for your organization, is to be realistic and focused in what you work to make happen given your resources. I think of this as the “depth and breadth” problem. Some organizations intentionally limit the variety of cloud usage patterns for compliance or security purposes, while others might arrive at a homogenous technological approach based on the nature of their business. Other organizations might see tremendous variation from one team to the next not just in technology used, but in the means of implementing each technology. Where a wider variety of tech patterns exist (more “breadth”), you will be less able to provide robust pathways to remediation (“depth”) for a given level of resourcing in your program.
The 11 step program of cloud efficiency-
Identify the technology costing your org the most $
Within that technology, identify patterns of wasteful use
Develop software to assess your entire cloud for these patterns
Run the software regularly and comprehensively
Calculate the savings opportunity of each observation
Make the data available along appropriate channels
For every facet of waste exposed, provide pathways to remediation
Establish a metric for cloud efficiency and solidify executive support
Repeat Steps 1-7, continuously expanding the set of wasteful patterns
If you must, allow exceptions
When and where appropriate, auto remediate!
1. Identify the technology costing your org the most $
This should be fairly common sense, but think of it this way – if your org is spending $1M/mo on EC2, and $10k/mo on SageMaker – even if somehow 100% of the SageMaker spend was waste and you brought it to $0, odds are even greater opportunities exist within that $1M/mo EC2 bill. Start with your biggest spend.
2. Within that technology, identify patterns of wasteful or sub-optimal use
Things get trickier here, and here’s where having cloud-tech-savvy members of the team (as discussed in the blog’s first post) pays dividends. In the case of AWS, Amazon can get you started with services like Trusted Advisor and Compute Optimizer. For most, underutilized EC2 instances are the biggest opportunity area, hence the variety of perspectives on EC2 right-sizing from AWS and others.
EC2 might not be the technical heart of your business – maybe it’s S3, DynamoDB, or any other service lacking rich native utilization efficiency indicators. In those cases, it’ll be up to you to understand how your teams are wielding these services, and determine what usage patterns are OK and which are not. You might also find the out-of-the-box recommendation sets insufficient and wish to generate your own.
3. Develop software to assess your entire cloud for these patterns
With a wasteful pattern identified, you now need software to generate and collect the data required to determine the efficiency of a service’s use. This data might be in the form of already-available metrics from AWS, but it might also be manifest in your own application or service logs and traces. It might be something new that needs code changes to create. Every one is its own adventure.
Within these processes, you’ll need to choose where to draw the line between efficient and inefficient use. In most cases usage efficiency falls upon a spectrum, and as the owner of the algorithm, you’ll need to be able to defend the choice you’ve made. Too low/conservative, and you end up ignoring potentially vast amounts of addressable waste and achievable savings. Too high/aggressive, and you risk incurring operational impacts, wasting time chasing low-value opportunities, and sparking the ire of teams held to unattainable standards. Don’t expect to get these all right out of the gate – do the best you can and iterate over time. Sometimes it makes sense to start with coarse, broadsword-style approaches, achieving greater surgical precision over time as more and better data becomes available. If you wait for perfect, you’ll miss months of real opportunity.
A completed software component evaluating a facet of cloud operation and returning opportunities for efficiency gains I call a Waste Sensor.
4. Run the software regularly and comprehensively
All this work spotting waste won’t bring full returns if only done occasionally, or against a subset of your cloud. Ensure your waste-sensing software runs regularly, in every corner, evaluating all occurrences of potentially wasteful usage.
Something you’ll likely find once measuring everyone with these sensors, is their desire to immediately see their remediation activities “move the needle” of measured waste. If the sensor is only running weekly, it could then be a week before teams see and can measure the results of their work. Daily is better, and even then you’re likely to have people asking for faster!
In addition, I recommend warehousing or otherwise tracking history from these sensors. With tracking you gain the ability to demonstrate how teams have taken action to reduce their measured waste over time. Along the lines of “If a tree falls in the forest…” is “If a cost savings effort was taken but not measured, did its savings really happen?” Clear, data-driven before & afters are feathers in the cap not only of the teams having taken the cleanup actions, but for you as a driver of the organization’s cloud efficiency.
5. Calculate the savings opportunity of each observation
Think of savings opportunity as the difference between the price as paid for the resource, vs. what it would have cost if the resource had been correctly configured, or retired if appropriate. Again some judgment may be required, there is no standard way of doing this.
I would suggest first choosing a standard timeframe of savings, for use across your entire fleet of waste sensors. It becomes a confusing mess if you’re measuring DynamoDB savings in $/hour, EC2 rightsizing savings opportunity in $/day, S3 savings in $/week, RDS in $/month. I find monthly works well because people can directly relate it to what they see on the invoice, or in their internal billing each month.
In AWS most costs are metered on an hourly basis, so it becomes a matter of calculating savings at that grain, then extrapolating out to your chosen common span. In the simplest case, consider an instance you’ve found severely underutilized; the team has deployed an m5.16xlarge instance, but based on the utilization metrics you’ve collected, an m5.2xlarge instance (1/8th the size) would provide more than sufficient resources to cover the system’s encountered load without incurring operational risk. If an m5.16xlarge costs $2/hour to run (making this cost up) then an m5.2xlarge should only be $.25/hour, for a savings opportunity of $1.75/hour. Extrapolated over an average 730-hour month, this is a $1277.50 opportunity.
If it were the case this resource was orphaned and a candidate for termination, the savings opportunity is the full $2/hour, or $1460/month.
In some situations the math on hourly pricing deltas is not as straightforward. In others, it may not be appropriate to perform a linear extrapolation out to a full month, if there’s reasonable expectation the resource and its descendants will not live that long.
By putting a dollar figure on every observed savings opportunity, teams are able to prioritize their efforts. If you have a good fleet of waste sensors, odds are nobody will be able to fix everything and get to zero waste. But with this common meter by which all different elements of their waste have been measured, they will be able to ensure they’ve at least addressed their greatest “bang for the buck” opportunities first.
6. Make the data available along appropriate channels
At this point in a database somewhere you have a listing of all the savings opportunities your collection of waste sensors have uncovered. What next?
At a minimum you’ll want to have a dashboard, report, or similar business intelligence artifact created to track everybody’s waste day by day. As mentioned above, attribution is foundational to this sort of effort, so at this point it should be academic to create org-wide rollup numbers, and provide drill-down into groups and subgroups throughout the org hierarchy, to see who’s wasting what.
Scorecard-style views, where the metrics of one group are plainly laid alongside another, can be great motivators to group leaders. Nobody wants to be at the top of the “wall of shame”.
In addition to rollup reporting for leadership (and to show off the efficacy of your program!) this data may also be suitable for programmatic consumption by individual development teams. Offering your findings through an API or similar programmatic methods allows the software and automation-focused dev teams to consume and process your insights in a manner familiar to them. The fewer manually-built spreadsheets that have to get passed around, the quicker and more comprehensively waste can be addressed.
7. For every facet of waste exposed, provide contextual pathways to remediation
Knowing is half the battle.
–G.I. Joe
The work thus far exposes and quantifies your organization’s opportunities to operate more efficiently and save money – you now know your waste – but so far nothing’s actually been saved. An important aspect of your program is that it facilitates quick, easy, low-risk, and lasting resolutions to observed inefficiencies. Every waste sensor must be accompanied by a treatment plan, with clear guidance provided on criteria of efficient operation.
This is where the depth/breadth factor comes into play. If you have a large and well-staffed team of cost optimization engineers addressing a tiny number of services all with common architectures, CICD pipelines, and programming languages, then you may be in a position to “reach in” quite a ways to the software dev teams. In theory you could provide suggestions for remediation at the source code level, but also anywhere in-between, like in their CloudFormation templates or TerraForm configs. For common patterns of underutilization (EC2), there exists third-party software you can purchase which can even do some of this for you.
In other situations, with a small team up against hundreds of approaches to dozens of technologies with almost nothing in common, you may not have resources to programmatically suggest higher-level pathways to remediation. This reality should be a factor for your organization in deciding what stance it takes on technology standardization. There may be benefits to allowing each team ultimate flexibility in how they code, deploy, and run their services, but that flexibility comes at the cost in additional effort and complexity when it comes time to optimize their unique approach.
8. Establish a metric for cloud efficiency and solidify executive support
As not all teams generate the same volume of spend in the cloud, it might not be fair to presnt the absolute $ waste of one team against another. Considering waste alone, a team incurring $100,000/month in waste might look awful next to one incurring only $10,000. However when it’s examined in the context of overall spend, where first team is spending $5M/month and the second only $50,000/month, the perspective shifts.
To account for this, I’ve found it valuable to establish a common metric thusly:
Using this measure on the above two teams, the first:
$100,000 / $5,000,000 = 2%
The second:
$10,000 / $50,000 = 20%
This approach normalizes efficiency across teams and spends of various sizes, allowing for use uniformly throughout the organization. With attribution in place, this measurement can be made at any level within the hierarchy – the whole company, large groups, all the way down to individual teams.
With a system of measurement in place, the next step is to set goals and drive teams to achieve them. This is where the establishing executive sponsorship comes into play. As a practitioner or even leader of cloud excellence within your organization, you are likely not in a position of significant authority to compel or even encourage teams to strive for a cloud waste goal. You need backing from those of sufficient influence to get all cloud operators in your organization to agree to be measured not just by pure budget adherence (or whatever other metrics they might already be assessed by) but also by this new metric.
You also need to help make sure everyone party to this measurement understands the purpose and reasonability of the metric. You’ll need to help establish reasonable goals and timeframes. For an org with a substantial cloud footprint just starting out but new to addressing waste, “We’re gonna get to zero waste in 6 weeks!” may sound great, but probably isn’t reasonable. But cutting measured waste in half by the end of year 1? That might be achievable if teams are given adequate cycles to focus on it.
9. Repeat Steps 1-7, continuously expanding the set of wasteful patterns
Those now subject to your cloud waste management program need to be open to an ongoing evolution in the yardstick of efficient operation. Everyone needs to know you’re “moving the goalposts” continuously, on purpose, and with your team’s full effort, so as to discover and address new patterns of inefficiency. A rich new source of savings should always be surfaced as quickly as possible, and not be put off to the next quarterly (or worse) metric review cycle.
The underutilized EC2 instance stone
There are a couple analogies I think of in regards to this continuous expansion. The first is the classic “leave no stone unturned”. Every different style of use of every different cloud service is itself a stone, underneath which potential savings from inefficient operation may be hiding. The continuous change in the ways a large organization uses the cloud and the constant influx of new and expanded services from the cloud provider, mean a constant influx of new stones worthy of investigation.
Offshore drilling of unattached elastic IP addresses
The other analogy, more relevant as the program matures, relates the process of cloud waste discovery to that of oil & gas exploration. A large organization’s cloud is a vast and rich place to discover people wasting money, just as the earth is a vast place with lots of fossil fuels tucked under the surface. But as with oil & gas, once you’ve tapped the big and obvious stores of value, subsequent discoveries are likely to generate smaller and smaller returns. At some point you’re going to be fracking for savings.
Eventually you may come across a use pattern generating only a few hundred dollars a month in waste in total across the enterprise. If the code to capture those opportunities was small and cheap to maintain and run, and the pathway to remediate quick, simple, and lasting for the teams affected, then it might be worth going after. But if not – if it required a complex new data pipeline, or if the opportunities were each very small, with risky and time-consuming steps required to remediate, then your organization may never see ROI on going after that waste.
At the same time, if you’re somewhere really big, try not to lose perspective. It may sound incredible if you’ve come from a small shop, but it might not be unheard of for a large enterprise to have millions of dollars a month in observed waste. In that setting, a new waste sensor exposing “only” $25k/month of new savings opportunity might feel not worth pursuing. That’s still $300k/year – so even if it takes an engineer a month to build and lots of time to maintain, there’s still a great return potential there.
10. If you must, allow exceptions
Once teams are held to a waste standard, you’ll see lots of interesting behavioral changes. The costs of technical decisions made in the name of disaster recovery, business continuity, or other – decisions potentially generating huge wasted cost in the form of underutilized standby resources – will be brought back to the surface for re-evaluation. It’s inevitable teams will seek exclusion for some of their resources from your waste sensors, and there’s one right and two wrong ways to handle this situation.
The first wrong way is to not allow any exceptions. In addition to making everybody mad at you and question the validity of the program, it ends up distracting people with savings opportunities which aren’t really addressable. Remember, it’s your objective to maximize the savings benefit to your organization, and that effort is impeded if teams are constantly having to filter-out things they can’t fix for various (and sometimes legitimate!) reasons.
The other wrong way is to allow anybody to exclude anything at any time without restriction. I can share an anecdote from a (large!) peer company who was struggling both to get tagging going, and to get their waste program launched. They eventually prepared and launched their first two waste sensors, one for EC2 instances and the other for S3 buckets. Along with the sensors, they allowed any resource receiving a certain tag key:value pair to be excluded from evaluation.
The company’s name, which I shan’t mention, always reminds me of Beaker the Muppet
Well wouldn’t you know it, practically overnight every single bucket and instance in their fleet was tagged for exclusion! Somehow the pressure of waste scrutiny cured their inability to effectively deploy tags. Unrestrained exclusion isn’t the answer either.
Instead, an approach allowing for appropriate and justified exclusions works best. A workflow begins when somebody requests an exception for a very specific technical pattern for a very specific business purpose. They provide thorough justification, and the request for exception should be reviewed for both its technical and business merits by approvers equipped to understand the situation and empowered to say no when warranted. Part of the process should include documentation of a plan to eventually address and remediate the wasteful pattern.
Only after the exception is approved should the waste be excluded from the team and overall company metrics. I recommend continuing to track this waste closely (but separately) so it does not become forgotten. Technically, tags work well for resource-level exclusions, but the automation should be in place to ensure only approved exception tags, applied to resources defined under the scope of the exception, receive exclusion.
11. When and where appropriate, auto remediate!
Keeping in mind the point of all of this is to save money, or at least, to have as little as possible going to wasteful ends – it ends up being the acts of remediation that take the effort across the finish line. Knowing what needs to be done is half the battle – getting people to act on those leads is the other.
When we know what needs to be done, and there’s a straightforward path to remediation, it begs the question, why not just fix it for them? The answer comes down to a new question of risk management.
Any change action, manual or automatic, brings with it risk of operational impact to the services or applications changed. There’s a fine balance of operational vs. financial risk which must be managed; part of what you need to do is help your organization find and maintain its ideal hinge point for each sensor.
By presenting opportunities but not acting upon them, you are offloading the risk management to the team closest to the infrastructure and best positioned to perform the analysis. When your systems are remediating issues on their behalf, you are taking on the risk of impact.
The risk equation can change as circumstances change. For instance, an automatic cost-saving measure that carries a small, but non-zero risk, may not make sense to run on the days leading up to Mother’s or Valentine’s Day, for a business that sells flowers online and counts on those narrow time windows for 90% of annual revenue.
It’s also important things be fixed the right way. In the classic example of an overprovisioned EC2 instance – it is not difficult to generate a routine which terminates, or even restacks the instance to a smaller type. However, in a modern infrastructure-as-code setting, all you’re doing is introducing configuration drift between the deployed infrastructure and the coded infrastructure; your fix will be undone the next time the infrastructure is restacked, which should be often.
We can’t do it from here, I’m telling you
Just like the electrician couldn’t properly shut off electricity to Nakatomi Plaza, there’ll be some cost inefficiencies you can’t fix by playing whack-a-mole in people’s accounts. It’s got to be done from downtown, or in our case, in the infrastructure’s source code.
For each type of waste uncovered, you’ll have to decide if there’s a path to automatic remediation, and when it is safe to act. You may be able to take a more aggressive stance on accounts or environments flagged as development/non-production, than you could in Production. You could also provide teams a means of tagging resources in a manner providing cost cleanup processes with additional guidance on what’s safe or not.
Increased investment and sophistication make more and more possible – for instance, if you can automate all the technical aspects of a fix but not the risk assessment, the remediation could be distilled down to a “One Click Repair” for the operating team. As with everything else in the broader cost opt space, survey the landscape and investment in the areas presenting the greatest potential return.
Conclusion
It can be a bit of work to build steam on a cloud efficiency program, but once some momentum has been built, excitement around its continued savings should help you keep it going. As with everything else cloud-based, data is abundant and your friend – use it to demonstrate the efficacy of your program and to reward teams for their success in eliminating waste. Nobody outside of Sales in your company can make as clear a case of their financial bottom-line contribution as you can in this role.
Unlike billing, you’re not starting off with the backbone of a solid data feed from the vendor, be prepared to have to build and maintain it internally.
In the next post, I intend to get into RIs and Savings Plans, which in my experience save 10x what a good waste reduction program can, despite requiring maybe 1/50th the effort. Despite this, people love waste sensors!
There is a theory which states that if ever anyone discovers exactly what the CUR is for and why it is here, it will instantly disappear and be replaced by something even more bizarre and inexplicable. There is another theory mentioned, which states that this has already happened.
(with apologies to Douglas Adams)
Compared to this blog’s previous post, things will get more technical in the second part of this entry. This deep-dive is somewhat necessary to set up some of the technical aspects of solutioneering for problem spaces we’ll cover in the blog’s future like amortization, rate-blending and chargebacks/allocations.
PART 1
In the first part are three high-level subjects to consider-
1. Is looking at the CUR right for me?
The CUR is one of the most lethal double-edge swords you can wield in managing and optimizing your cloud. There are a great number of gnarly problems you just can’t solve any other way. For the problems where there are other solutions, mastery of the CUR will enable results which are more precise, thorough, and timely than possible by any other approach. This is because whether you’re using Amazon’s own Cost Explorer, a SaaS-based cloud management company, or one of any number of open-source reporting utilities, underneath the covers, the CUR is the primary data source forming the data backbone of each. By depending on others’ solutions, you’re beholden to their timelines, and to how they’ve each decided to interpret and present the same underlying truth. Instead of bending the cloud to suit your business, you’ll be bending your business to fit your chosen cloud-bill interpreter.
At the same time, making the CUR part of your solution set is a path fraught with peril, and isn’t the right choice for everyone. Success or failure in the effort is dependent on how well you are able to insulate your end users from the gaps, inconsistencies, and constant stream of changes inherent within AWS. To solve a persistent and mission-critical business need through independent CUR processing is to hang a sword of Damocles over your team. A circumstance where you’ll find the collective professional aspiration of the Product Manager army representing Amazon’s 200+ services – while maybe not to intentionally harm you – is to introduce the most change possible, every headline an arrow sent towards the thread by which it hangs.
As someone responsible for cloud cost management for your organization, it’s important to recognize if and when it’s time for your organization to take this on. Many fail to even consider it an option, long past the point in their cloud journey where it could have provided great benefit. When not having the critical insights needed to make key decisions (including managing RIs and Savings Plans to a high level of excellence) costs orders of magnitude more than a couple data engineers, it might be time to get started. Just know that other than this blog post, there is no guidebook out there on how to do it – you’re on your own.
2. The AWS Business and Billing Model
Business
When dealing with the CUR but also AWS in general, it can be helpful to not think of it as a single company – instead, think of it as “The United Services of AWS”. As of this writing, AWS has 212 active services – every one a member state of the larger AWS nation. Each has its own leader, who – like a state’s governor in the early days of the USA – is empowered with tremendous autonomy to achieve their business objectives. This dynamic will come into play later when we talk about EDP and negotiating with Amazon, but for now it’s important to understanding the maelstrom that is your billing data.
The biggest features and fixes AWS cranks out are put together by laser-focused two-pizza teams within those individual service organizations. Groups that small aren’t equipped to comprehensively assess the impact of their activities outside of their service – especially (but not limited to) non-revenue-generating services like Cost Explorer. This is why – if you’re watching closely – you’ll regularly see a new technical feature completely break something in Cost Explorer, or launch with its critical business-management counterpart capabilities lacking or completely absent.
Highly distributed autonomy allows AWS to move with an extraordinary speed and agility their competitors cannot match. Every one of those two-pizza teams is sprinting through the bare minimum of red tape to deliver for their customers. For enterprise-scale customers however, there are downsides* to this approach. There can be a lack of consistency across the AWS nation in how problems are solved. As a customer, many more relationships end up needing to be established and maintained to ensure the pressure of your dissatisfaction is landing on the right throats.
*As with everything Amazon, they are self-aware enough to remain mindful of these shortcomings and continuously work to mitigate them without sacrificing their trademark speed. In the years I’ve been dealing with AWS, the Cost Explorer team, the TAMs, and our actual billing data, all have made great strides in becoming more enterprise-friendly. Still, “No compression algorithm for experience” cuts both ways and Microsoft’s decade-plus head start in servicing enterprises cannot be overlooked as a plus for Azure.
Billing
Every AWS service meters your usage just like usage of utilities is metered in your home. It can be helpful to visualize your usage of cloud resources like having a light on or running the faucet. The higher wattage that bulb, the bigger that faucet, and the longer they’re on, the more electricity and water you’ll consume, and the more it’ll cost.
Some AWS services can be described using only a few simple meters, just like a home (water, gas, electricity). Others require dozens of meters, and for a monster like EC2, there are at least several thousand different types of meters you can spin with your usage.
In AWS, most services report meter readings every hour (some, like S3, only once per day). This raw meter data is sent from the utilized service in to the central Cost Explorer group. This group looks up the appropriate rates for every different type of meter and multiplies it by the usage amount, to determine the cost for that type of usage for that hour. It then decorates the usage with relevant tags and other metadata needed to flesh out each line of your CUR. From there, the CUR is published out to S3 per your specifications.
Each CUR is a restatement of the entire month-to-date. Doing it this way, instead of an incremental feed, allows AWS to repair anything that might have gone wrong in a previous hour. Remember, everything you see is an estimate until the month is fully closed out.
All of this can be quite a bit of data – to illustrate, the author’s personal/home AWS account generates under $40/month in spend, utilizing fewer than 10 AWS services. However, it takes about 60,000 rows of data to describe the charges incurred by this tiny account over one month. Per hour, that’s about 80 rows of data to describe $.05 worth of use. While this ratio won’t hold in all cases, if we apply it to AWS’s first $10B quarter, 1600 rows per $ of revenue it maps to over 5 trillion rows of billing data available to customers each month. I wonder what fraction of that is being analyzed in much detail?
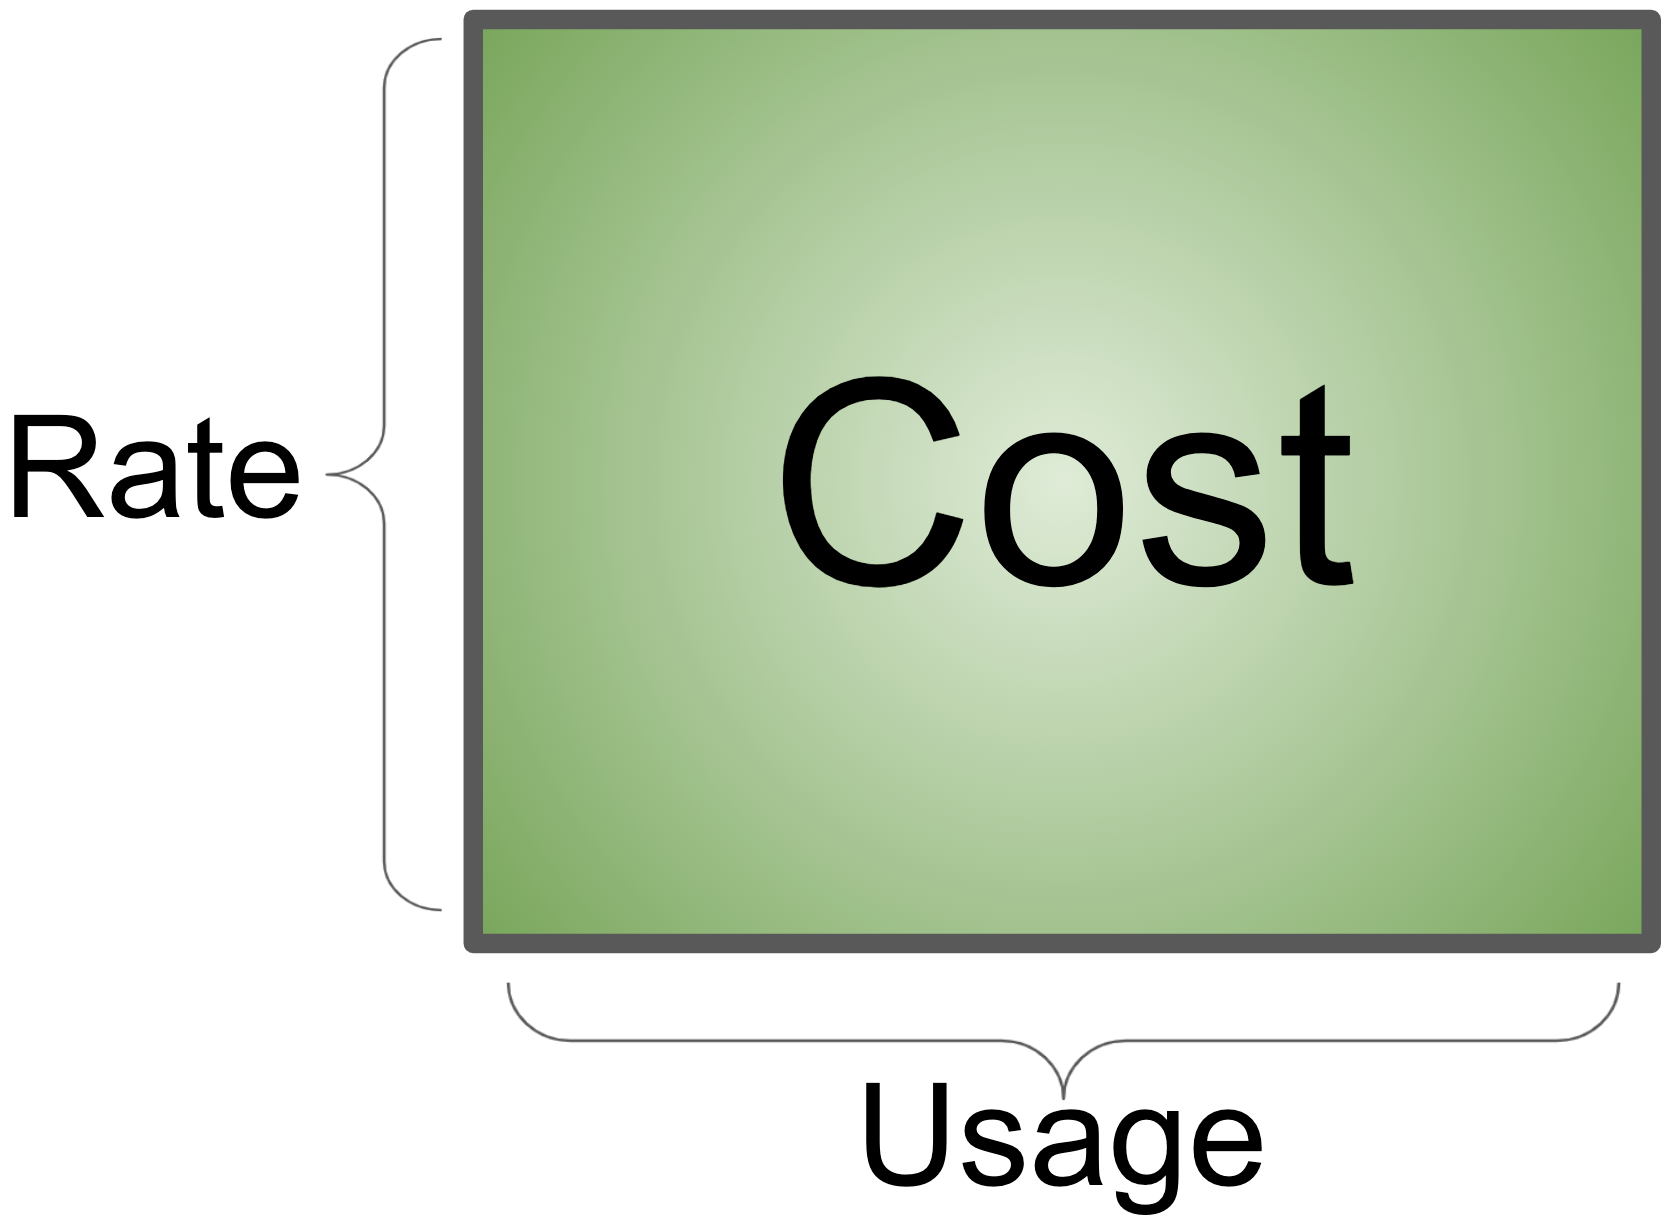
The core action performed by the Cost Explorer group above – attaching a rate to a usage meter, is what I consider the first principle of cloud spend:
Cost = Rate x Usage
Expressed geometrically, your Cost is a rectangle whose area is the product of sides Rate and Usage-
Everything you do to optimize your organization’s cloud spend, is done by either reducing the rate paid, or by reducing the usage amount. With as highly technical as some cost-opt discussions can get, it’s important to not lose this footing.
It is too easy to get fixated on shrinking one side of the rectangle, paying too little attention to the other. In my experience the background of the person or team heading cost optimization predicts the focus area – Finance types tend to focus on rate-reducing activities, while technical Cloud types tend to focus on usage-reducing activities. As you might imagine, the best results will tend to come from a balanced evaluation of the opportunity space, which is only possible if the team working on it is itself well balanced.
3. Is AWS Overcharging Me?
Maybe, but unless you can read your CUR, how would you know? 😉
In reality, the answer to this question is “Probably not and if so, not only is it not on purpose, they’re just as likely to be shortchanging themselves”. In my experience, the AWS CUR is a very high quality data source when dealing with normal billing situations. What you get is much more reliable, comprehensive, and trustworthy than anything your internal IT department could ever generate. While this may not sound surprising, I find it a stark and refreshing contrast with the telecom industry, where intentional, systemic overcharging and obfuscation have been the norm for decades.
The place to be extra vigilant is where any sort of special arrangement has been made with AWS, especially where there are manual steps in implementation. The circumstances of how such an arrangement could come to be will be covered in greater – though certainly not NDA-violating! – detail later, but for now, if you’re worried something isn’t right in your bill, the place to look is everywhere any sort of special deal has been made, to ensure it’s been implemented correctly.
For all the technology and sophistication, AWS is still run by human beings, none of whom are infallible. So, if you’re worried about being overcharged and have some cycles to actually investigate, focus first on the areas where somebody at some point, had to manually provide input to a process that would otherwise have been fully automated. This same common-sense principle really ought to be applied to the review of any significant bill.
PART 2
Returning to the quote at the beginning of this post, things in AWS change at a dizzying pace, making it difficult to to comprehensively document anything. If it takes more than a few hours to write a document, you can be certain some part will have changed since you started. What follows is especially susceptible to this phenomenon.
Originally I’d intended to cover some common use cases in the use of CUR data after breaking it down, but the post ended up too long as is. Can look into this in a future post – if there are any use cases of particular interest, you can always email me the suggestion.
Breaking Down the CUR – The Assembly
As a large and complex body of information, we’ll need to take a divide-and-conquer approach to how we familiarize ourselves with it:
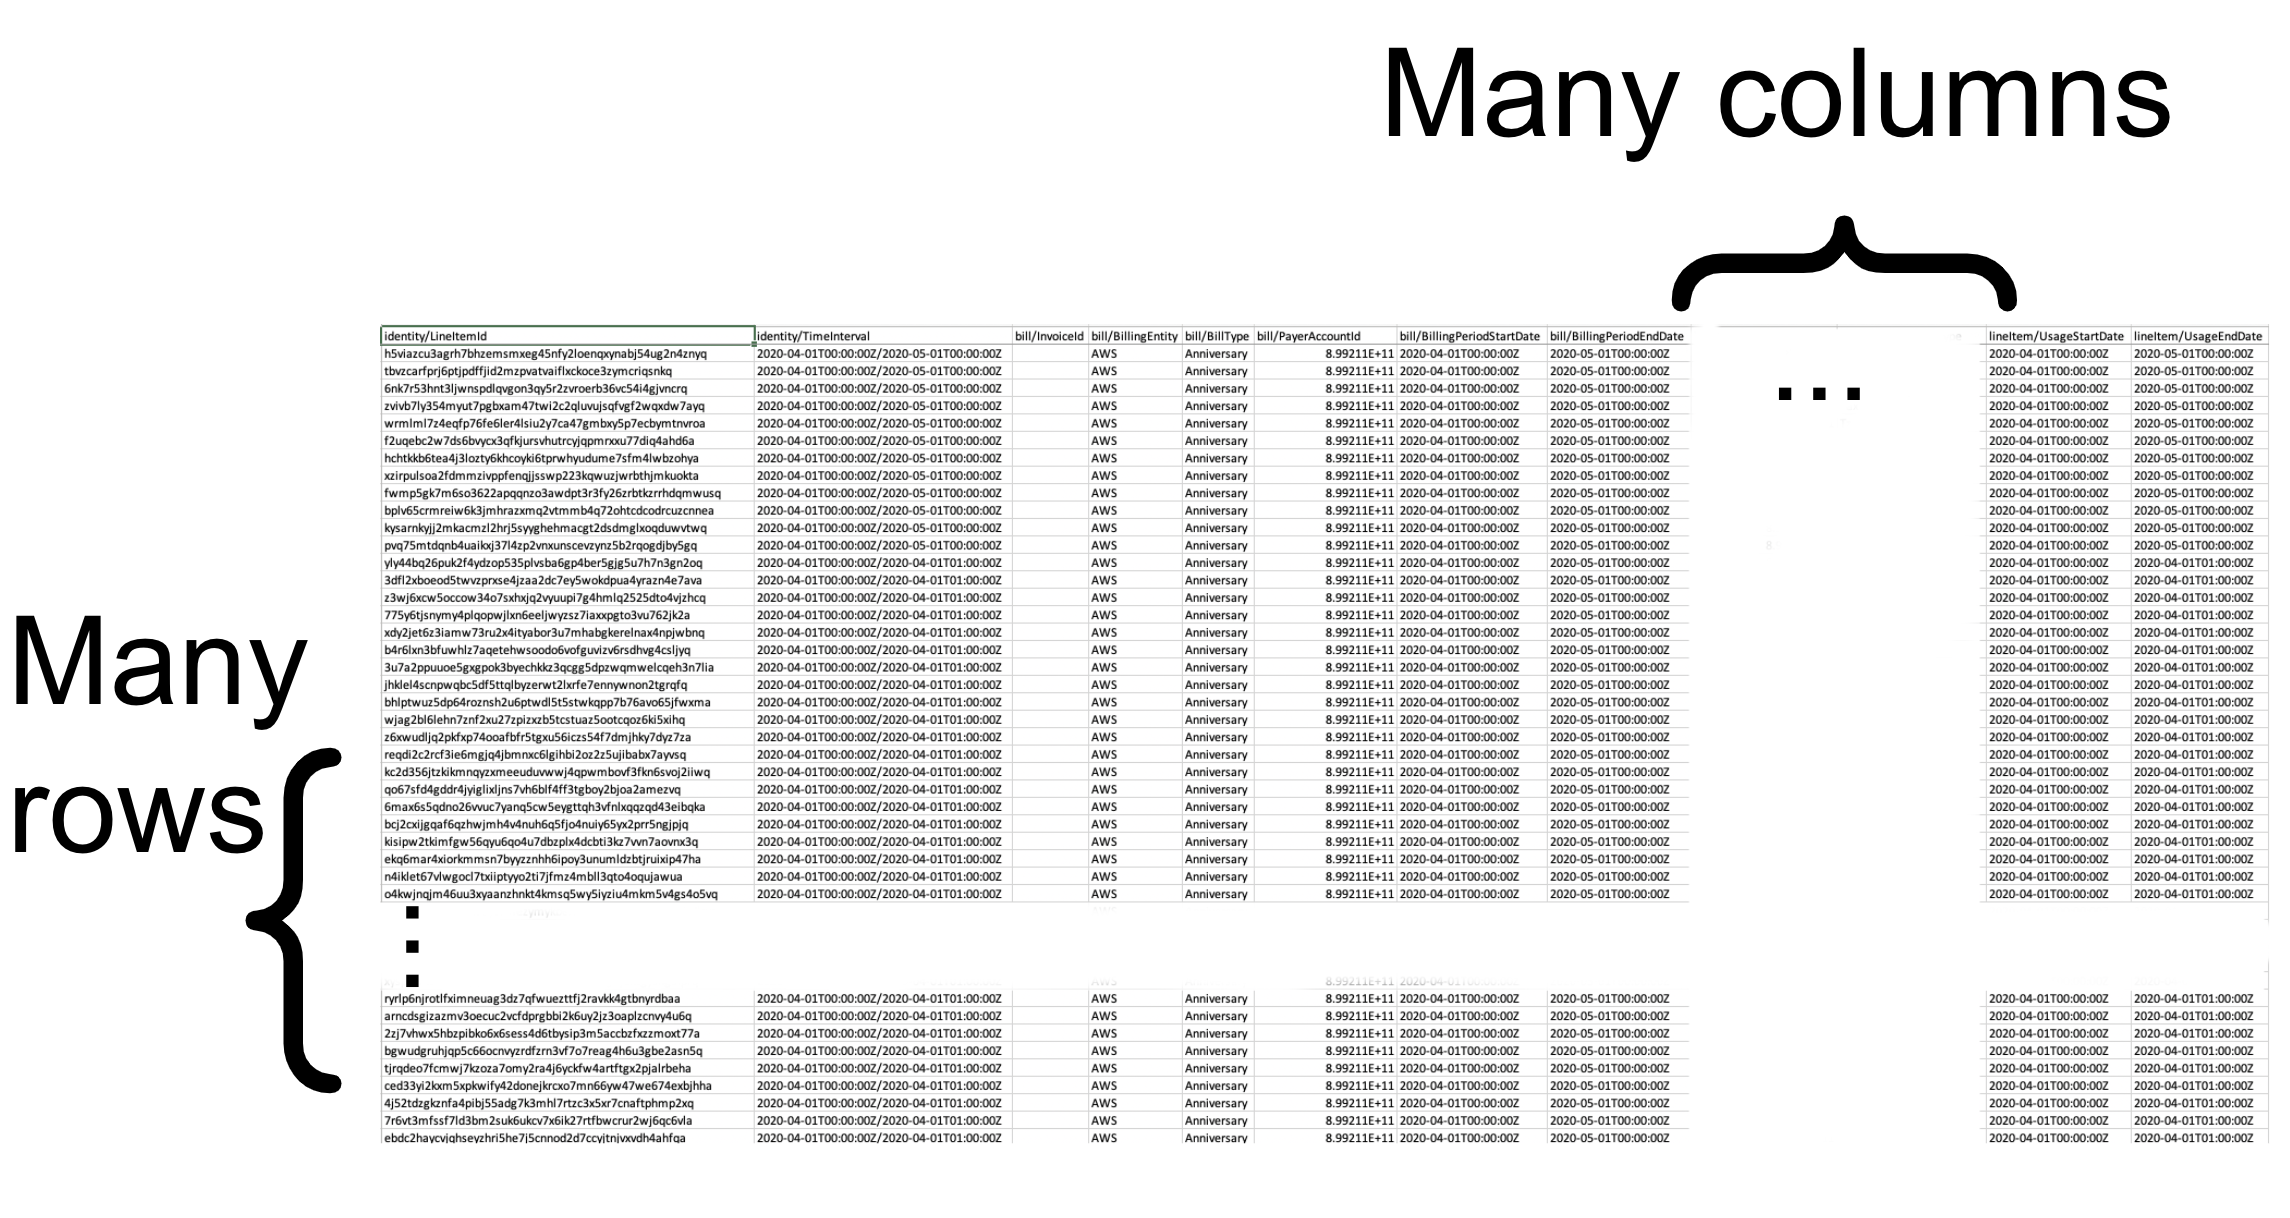
Thousands of columns x potentially billions of rows = trillions of data points in one AWS CUR
Most simply, the CUR can be thought of as a gigantic spreadsheet. If your organization is small enough, you might even be able to gain the insights you need through a few clever macros and charts. However, it is very easy for even a modest org to blow past the million-row limitation of popular spreadsheet programs. You can configure the CUR to arrive at various levels of pre-aggregation, however the focus here will be on the least aggregated (most detailed) version, the one with Resources and Tags.
When delivered to you in S3, if you choose the g-zipped CSV format, it will arrive as one or more files in what AWS calls an assembly. In a large enterprise, there may be thousands of files in one assembly. Each file’s size is capped such that when unzipped, it should be readable by Excel. The start of the first file contains the “abnormal” rows (how they are abnormal will be covered next) followed by the normal rows.
Within the assembly once normal rows begin, the first AWS account’s costs will be listed out in their entirety. BTW – if you’re not familiar with AWS Accounts and Consolidated Billing, this AWS page is a good place to start; your organization should absolutely be using consolidated billing if it isn’t already. If there’s room, things will go on to the next account, and so on – there may be several accounts whose costs are listed in one file. When a maximum amount of data has been generated, it will create the next file and continue. This may happen in the middle of the listing-out of a single account’s costs – there is no guarantee one file will contain all of the account’s costs. This is important to know if you’re trying to understand the costs of a large account using Excel – one file may not have everything, you may need the file(s) that came before or after to complete the picture.
Rows
If the rows of your CUR are the “what” of you bill, the columns contain the descriptive “how” of your cost and usage. The vast majority (a true 99.9% or more most of the time) of your rows will fit the normal pattern – for a specific hour, within a specific account, for a specific AWS Service, you consumed a specific amount of a specific type of resource, which has a cost.
The other .1% – the rows at the beginning of the first file in an assembly – are the abnormal ones. The main way to distinguish these rows is to recognize they do not cover just one clean hour of use (column lineItem/UsageStartDate does not start on an hour boundary or is not exactly one hour before lineItem/UsageEndDate)- they might cover a whole month, or even multiple month spans. Here are the sorts of things that show up in here – this is from memory and by no means exhaustive:
Reserved Instance and Savings Plan purchases
Credits and refunds
Taxes
Domain name registrations
Enterprise support
Weird costs (the possibilities are endless!)
As we’ll see later when talking through amortization and allocations, the way these rows need to be handled will differ from the 99.9%ers. For the discussion on CUR columns to follow, the context is for normal rows. Abnormal rows share the same schema, but tend to be loaded differently – you can tell the AWS-internal teams trying to fit their data in encountered many square-peg-round-hole scenarios and just did the best they could.
Columns
Amazon provides a data dictionary for the CUR, which includes a link to a ZIP file containing a listing of the (as of this writing) 5277 possible column/service combinations.
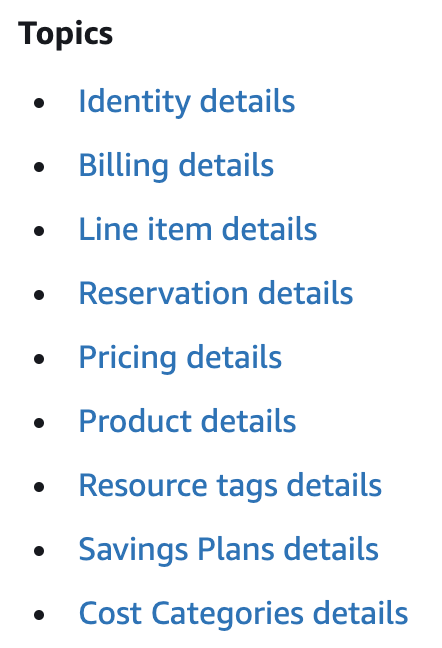
The fields/columns of the CUR are broken up by subject area, AWS calls Topics:
9 now – by the time you read this, ??
When I first looked at the CUR I think there were only 6 topics, there are now 9. By the time you read this, it may be well into double digits.
Each topic contains a collection of columns. There are way too many to go into detail on each; instead I’ll provide some commentary on the most important ones.
Identity
identity/LineItemId – Everybody who first looks at the CUR sees this and thinks “Ahh good we can use this to make processing of the CUR an incremental process, and maybe we should use it as a primary key.” Unfortunately here these instincts betray their holder, as neither work. First, the LineItemIds are not kept constant between CURs – they are all new each time. Second, they are not even unique within a CUR – they are *usually* unique within an hour within a CUR, but even then, not always. This field ends up being mostly useless.
Billing
Nothing here of terrible interest. Certain costs will be split out into separate sub-“bills” but costs are costs.
Line Item
This is where all the best stuff is, and where most of your attention should go. For those who have been around since the days of the DBR (the billing artifact predating the CUR), most of what’s in LineItem is a carryover of the DBR’s 20-ish fixed fields.
lineItem/UsageStartDate – As we talked about in the Rows section, for 99.9% of your data, this will be a clean hour start, with the matching UsageEndDate exactly one hour later. This describes the hour where the usage row occurred. For any large enterprise where you have a lot of data, and especially if you have the capability to query across months, you’ll want to scope your examination to a narrow range of UsageStartDate(s). This column makes a great candidate as a physical sort key if you’re warehousing the data.
lineItem/UsageAccountId – The AWS account performing the usage. While a fairly simple concept, this field ends up providing for a powerful boundary between costs in your cloud.
lineItem/ProductCode – The AWS Service (EC2, RDS, S3, etc.) within which the usage and cost occurred. You’ll see the same service referred to by slightly different names (“AmazonEC2” here, “Amazon Elastic Compute Cloud” over there) in other columns, but this one is generally suitable for reporting. Also of note, some versions of the CUR or other cost reporting which are more aggregated have costs rolled up differently. For instance, in the detailed CUR you’ll see a lot of networking charges incurred in the context of the EC2 service, but in their more aggregated reports these are moved to a “Data Transfer” service.
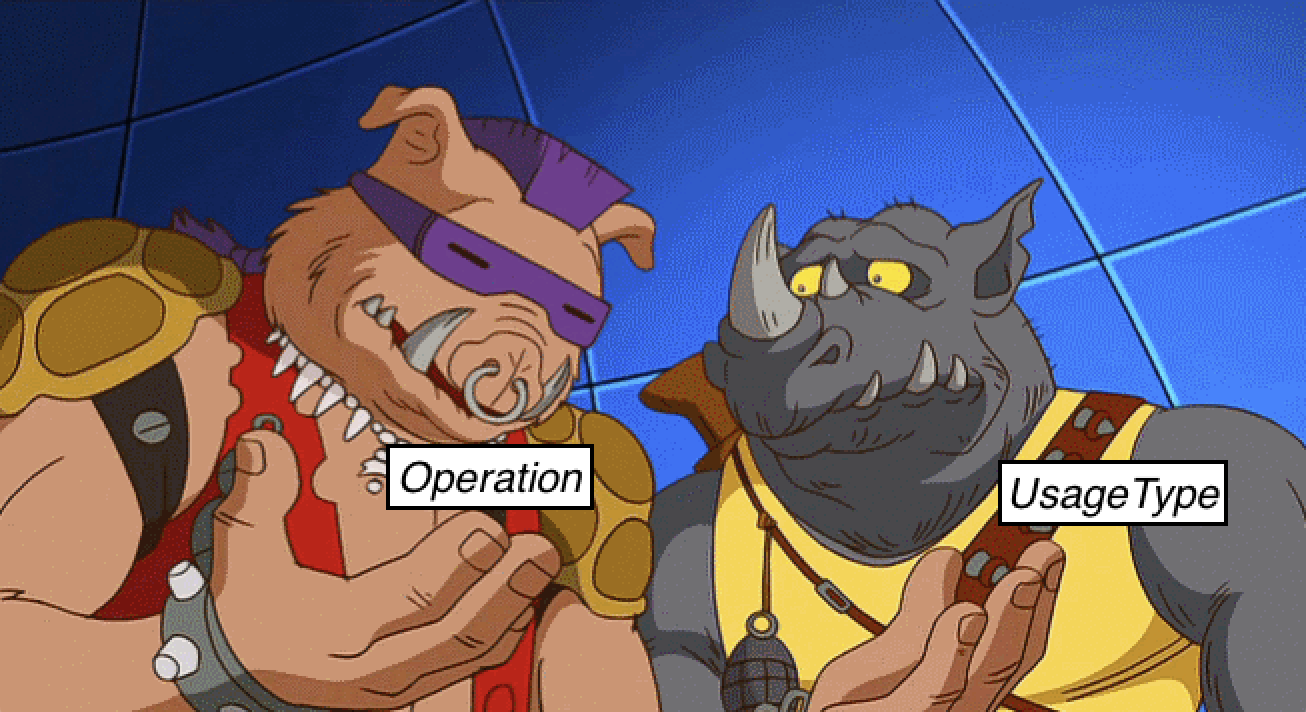
lineItem/Operation and lineItem/UsageType – Batman and Robin, Riggs and Murtaugh, Lilo and Stitch, Rick and Morty, Bebop and Rocksteady – these are your favorite dynamic duo providing technical insight into the usage. When it comes to understanding the nature of one’s baseline and changes in cost and usage, these are the two most important columns in the CUR.
If this image helps you remember the two most important columns, it will have done its job!
Which of the two will provide the more valuable clue in any given circumstance is not a given. I tend to think of UsageType as a drill-down of Operation (where you’d drill down from lineitem ProductCode -> Operation -> UsageType for increasing detail), but it doesn’t always work that way. When people come to you asking “why have my costs gone up?”, the answer is almost always due to in increase in some type of usage (“because you tripled your use of EBS storage in the us-east-2 region”) – and these are the columns which tell the tale.
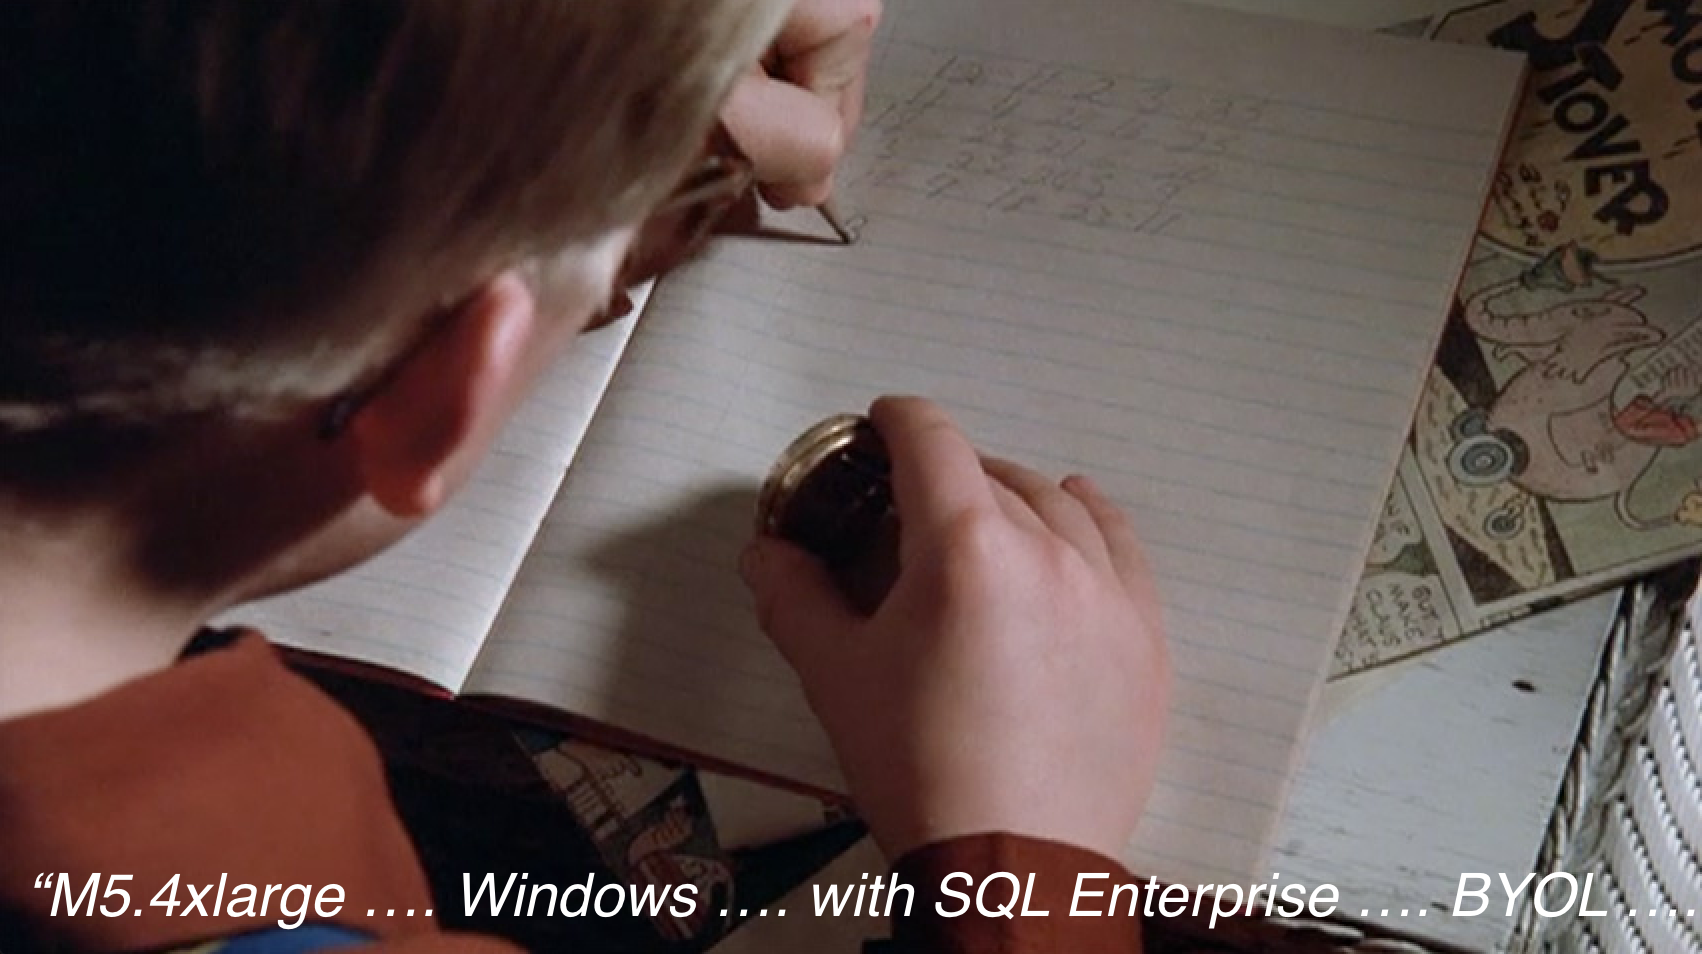
These columns are of particular interest when it comes to gaining a better understanding of your use of instances. For most organizations, the use of instances (EC2 boxes, RDS databases, Redshift clusters, etc.) comprise the majority of costs. Yet, from the CUR’s perspective, they tend to comprise a small fraction of the data. You may find >75% of your costs are represented by <5% of the rows in your bill. As such, it may make sense to gain a deeper understanding of those instance rows, to understand all their nuanced characteristics. Things like the region, instance type, tenancy, operating system, pre installed software, licensing model – and that’s just for EC2. Thoroughly understanding your instance fleet will be a necessity later when we talk about Reserved Instances and Savings Plans.
Side note: AWS must have once thought Virginia (aka US-East-1) would be their only region. The UsageType field is generally formatted as [region abbreviation]-[UsageType] - except when the usage is in Virginia. The absence of a region means US-East-1, but it also means instead of being able to reliably split the string on the first hyphen and take what's to the left as a region code, you need to stay on your toes.

Side note 2: Ditto m1.small as the "default" instance type. A normal UsageType line for an EC2 instance might look like:
USW2-BoxUsage:t3.medium
But for an m1.small in US-East-1, you'll see:
BoxUsage

Fun eh?
Unfortunately, none of the instance characteristics are natural columns in the CUR – they all have to be derived from Operation and UsageType. Effectively, these columns are “overloaded” in that they have to carry 10 fields’ worth of data in those two columns. To fill-in the picture, you need to parse and decode these two fields to populate all the different fields needed to fully describe your instances.
Doing this entails decoding some secret-feeling codes in the Operation field. If you dig, there are some clues out there on how to decode this, but none of the info you need to reliably unscramble the AWS cipher is available programmatically. Good luck code breakers!
lineItem/LineItemDescription – An attempt to describe the usage in plainer english than the operation and usagetype codes. This column tends to not introduce much if any additional cardinality to the data, but it can be handy in accompanying the dynamic duo in helping to better understand the nature of the cost.
lineItem/UsageAmount – How much you used. This is a numeric value which only tends to make sense in light of the LineItemDescription. A common mistake I see people making is trying to sum this value across a service like S3. There, you’re charged a couple cents per GB-month for storage, but for other things like GETs, you’re charged 4 cents per 100,000 GETs. So you might have tens of millions of GETs in a month but only a couple hundred thousand GB-months of storage. Big changes in GETs have a small effect on the bill, where small changes in GB-months of storage have a relatively large effect. Aggregating UsageAmount across different usage types is like mixing milk and orange juice – yuck!
lineItem/UnblendedCost – This is the most raw view of what AWS thinks this bit of usage cost. It is restated in various ways, but those are all some interpretation of this base value. AWS provides this as the result of the calculation:
UnblendedCost = UnblendedRate * UsageAmount
Which should look familiar, it’s our first principle of cloud cost from the first half.
lineitem/ResourceId – while not always populated, the ability to reference this column is one of the most powerful capabilities of the CUR. It allows you to understand the size/usage and cost of individual items in the fleet. This is where you can find the answer to questions of the form “what is this specific [s3 bucket or RDS DB or Dynamo Table] costing me?”. This level of detail is not present even in Amazon’s own Cost Explorer reporting tools.
AWS provides a partial list of resource types by service. There are many more than this listing, you’ll have to explore each service to understand the level of detail in tracking.
AWS Service
Resource Identifier
Amazon CloudFront
Distribution ID
Amazon CloudSearch
Search domain
Amazon DynamoDB
DynamoDB table
Amazon Elastic Compute Cloud – Amazon EBS
Amazon EBS volume
Amazon Elastic Compute Cloud
Instance ID
Amazon Elastic Compute Cloud – CloudWatch
CloudWatch charges for an instance ID
Amazon EMR
MapReduce cluster
Amazon ElastiCache
Cache cluster
Amazon Elasticsearch Service
Search domain
Amazon S3 Glacier
Vault
Amazon Relational Database Service
Database
Amazon Redshift
Amazon Redshift cluster
Amazon Simple Storage Service
Amazon S3 bucket
Amazon Virtual Private Cloud
VPN ID
AWS Lambda
Lambda function name
A partial list of resource types by service. You’ll find more when you dig!
Having the ResourceId is part of why the CUR has so many rows. The collection of S3 buckets in an account might only generate 10 different types of charges in a day. But if you have 40 buckets in the account, the amount of cost and usage for each bucket is tracked, so the number of data rows is multiplied 40x. The same is true for every other resource type.
Of note, I’ve often been asked for the cost of individual objects in S3. Were AWS to bill at the S3 object level, we might see trillion-row CUR files, as it’s not hard to end up with millions or even billions of S3 objects. If this path of inquiry can’t be dismissed in your situation, AWS offers the S3 Inventory service if you want to get down into the Quantum Realm of your bill.
Reservation
A collection of fields relating to the application of Reserved Instances.
reservation/ReservationARN – Useful when trying to understand where you have RI waste and outstanding savings opportunities. RIs are slowly being phased out by Savings Plans.
Pricing
pricing/publicOnDemandCost – this one is interesting to track and preserve if you end up doing any rate manipulations. Think of it as the “retail price” of what got used. This might be helpful later in calculating realized savings. pricing/publicOnDemandCost – {my net cost} = my savings.
Product
This is perhaps the most dangerous collection of columns within the CUR. Depending on which services you use, there may be several hundred fields. Wield them at your own risk! At first glance the content here looks rich and appealing, especially for those coming from the previous DBR product. Comprehensive details about the products in use, in theory relieving analysts of the burden of having to research this information and marry it to the usage independently.
Unfortunately, these columns tend to be very sporadically populated. Some may be populated “most of” the time, but what are you going to do when they aren’t? Or when AWS decides a column that since forever has only ever been null or held integers, should start holding ‘N/A’. In my experience these columns are not dependable enough to be of regular use in downstream analysis and calculation. Only use this data if it can’t be obtained from a more reliable source.
Resource tags
Ahh, tagging. There are two classes of tags that’ll come through here –
resourceTags/aws:[tag key]
resourceTags/user:[tag key]
Tagging is a deep subject worthy of a post by itself, which will come later when we talk cloud attribution. These columns are where your hard work in applying tags pays off – the resources you’ve so diligently tagged, will see the values populated in their tag key columns. Except for that very long list of oft-expensive untag-able things. Uh oh!
I see tags best used as a last line of defense in attribution, where much industry literature shows people using it as the end-all, be-all. More on this to come.
Savings Plans
Similar to the Reservation field set.
savingsPlan/SavingsPlanArn – tells you which Savings Plan was applied where. Amazon provides a couple other columns where they’ve “helped you” by doing a number of savings calculations. My advice is to lean on the CUR for the core/raw “essential nutrients” of what happened and to perform the calculations yourself.
Cost Categories
A very recent add – Cost Categories didn’t even exist when the blog was first started. Third party Cloud Cost Mgt companies saw the need for this capability years ago so it’s not a new concept.
Concluding Thoughts and War Stories
The decision to make the CUR a core part of your organization’s cloud business management function is not one to be made lightly. Done well, it can enable a depth of comprehension to your cloud operation AWS and third party tools can’t match. Done anything less than really well, and the choice may be career-limiting.
I often hear stories from peers with scary bits like
"...and then when AWS released Savings Plans all our custom reporting was broken for 3 months..."
Similar horror stories when EC2 switched to per-second billing, when Convertible RIs were released, in implementation of On Demand Capacity Reservations (ODCRs), and so on.
Getting a basic pipeline stood up to provide insight is one thing – keeping it accurate and relevant against the flood of Amazon product activity, is another. If you are successful, you’ll be able to steer your org in the right direction much more deftly than those who are stuck waiting months for AWS or third parties to update their reporting software to reflect the new state. At scale, those quick pivots can pay for years of your cost opt team’s salary. At the same time, it allows your organization to bend its cloud data to the shape of its business, instead of feeling forced to shift its business to fit others’ limited cloud management paradigms.
The CUR is a pathway to many capabilities some consider to be … hard to maintain.
Much of the last 4+ years of my career has been spent writing programs to fill gaps in the CUR so people and processes could make sense of what happened in their cloud. Then completely changing those programs when AWS changed how they do things with no warning and for no apparent reason. Staying on top of the mission of bill interpretation is a full time job – and Amazon’s pace of change is only accelerating.
Still, in light of what’s happening to the world economy and what it probably means to your own organization, there may never be a better time to get started.
Cloud…bombe? No not bomb! For those not familiar with the life and work of Alan Turing – among other accomplishments, he advanced a cryptographic device known as the bombe – to crack the Enigma machine’s cypher and help turn the tide of WWII.
Anyone who’s sat down in front of the AWS Cost and Usage Report (CUR) to try to answer a question for their organization can relate to how Allied naval officers must have felt when they picked up an Axis u-boat transmission. “The information I need to plan my next move is in there, but how do I translate it into something I can use?“
The theme of this blog is to equip every AWS customer with their own cloud “bombe” – the knowledge, skills, and tools needed to fully understand what they have going on. Thus armed, the cloud cost practitioner is empowered to make the right moves at the right time and optimize their organization’s key outcomes.
For large enterprises, the difference between cracking this code or not can mean tens or even hundreds of $Millions in annual cloud cost. For tech startups where cloud might be an even larger share of overall costs, it can influence whether or not there’s funding enough to hire that new hotshot developer and deliver on the killer new feature sought by a collection of would-be customers.
Nobody is perfect or has this all figured out – and even if they did, Amazon’s staggering pace of product and feature releases would see this perfection crumbling to pieces by the next press cycle. Staying on top of cloud costs means weathering this storm – establishing the core principles as your organization’s guiding compass, then taking each course-altering blast of wind and tidal wave from AWS as they come, keeping it all on track as best you can.
Who should be looking at Cloud Cost Management at my Company?
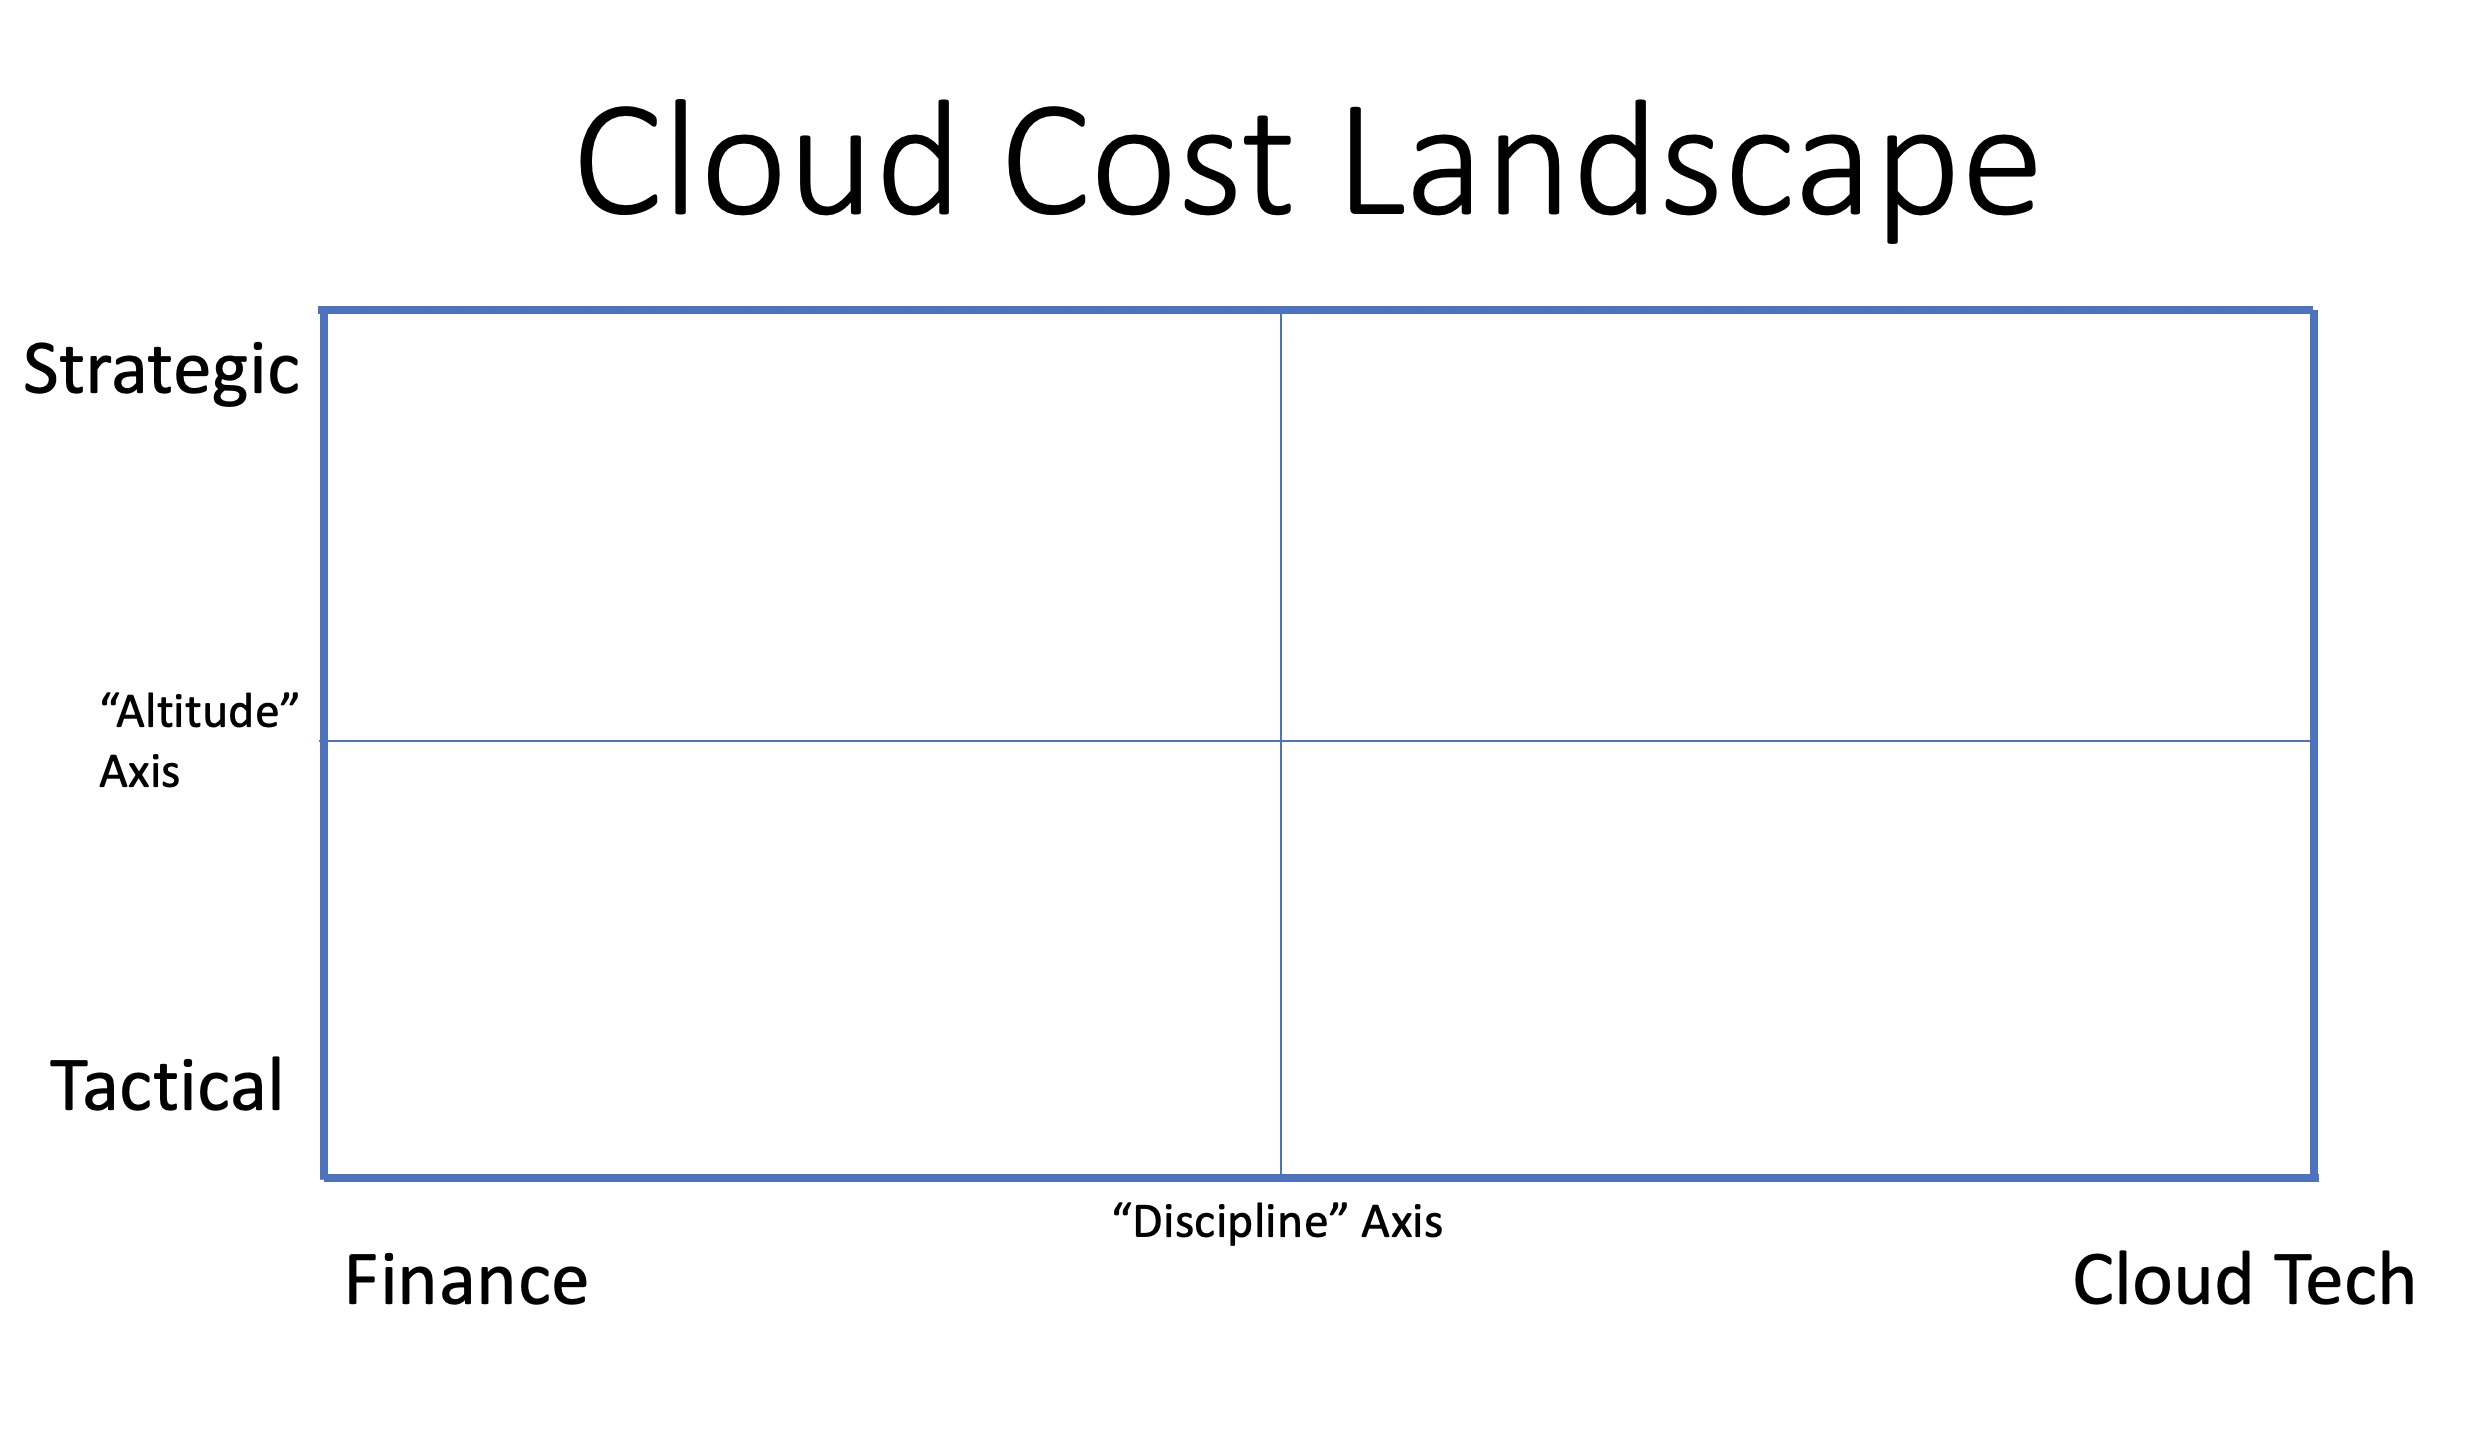
The problem space for cloud cost management is large and multi-dimensional. To get started in thinking about how to best line up your organization’s resources to meet the challenge, we’ll start with this diagram:
In this graph, the vertical or Y-axis is the “Altitude” Axis. A value higher (more towards the top) of the graph indicates a problem that is more strategic in nature. In this context, a strategic decision is one that is more abstract, has farther-reaching consequences, and is probably more heavily deliberated. The highest-level of these decision types are generally made by a function’s executive leadership. A lower placement on this axis, indicating a more tactical problem, are the sorts of things dealt with more often, and by persons closer to the front lines.
The horizontal or X-axis is the “Discipline” Axis. While in reality many disciplines will be brought to bear, the spectrum of this axis has traditional Finance/Accounting at the far left, and traditional Technology at the far right.
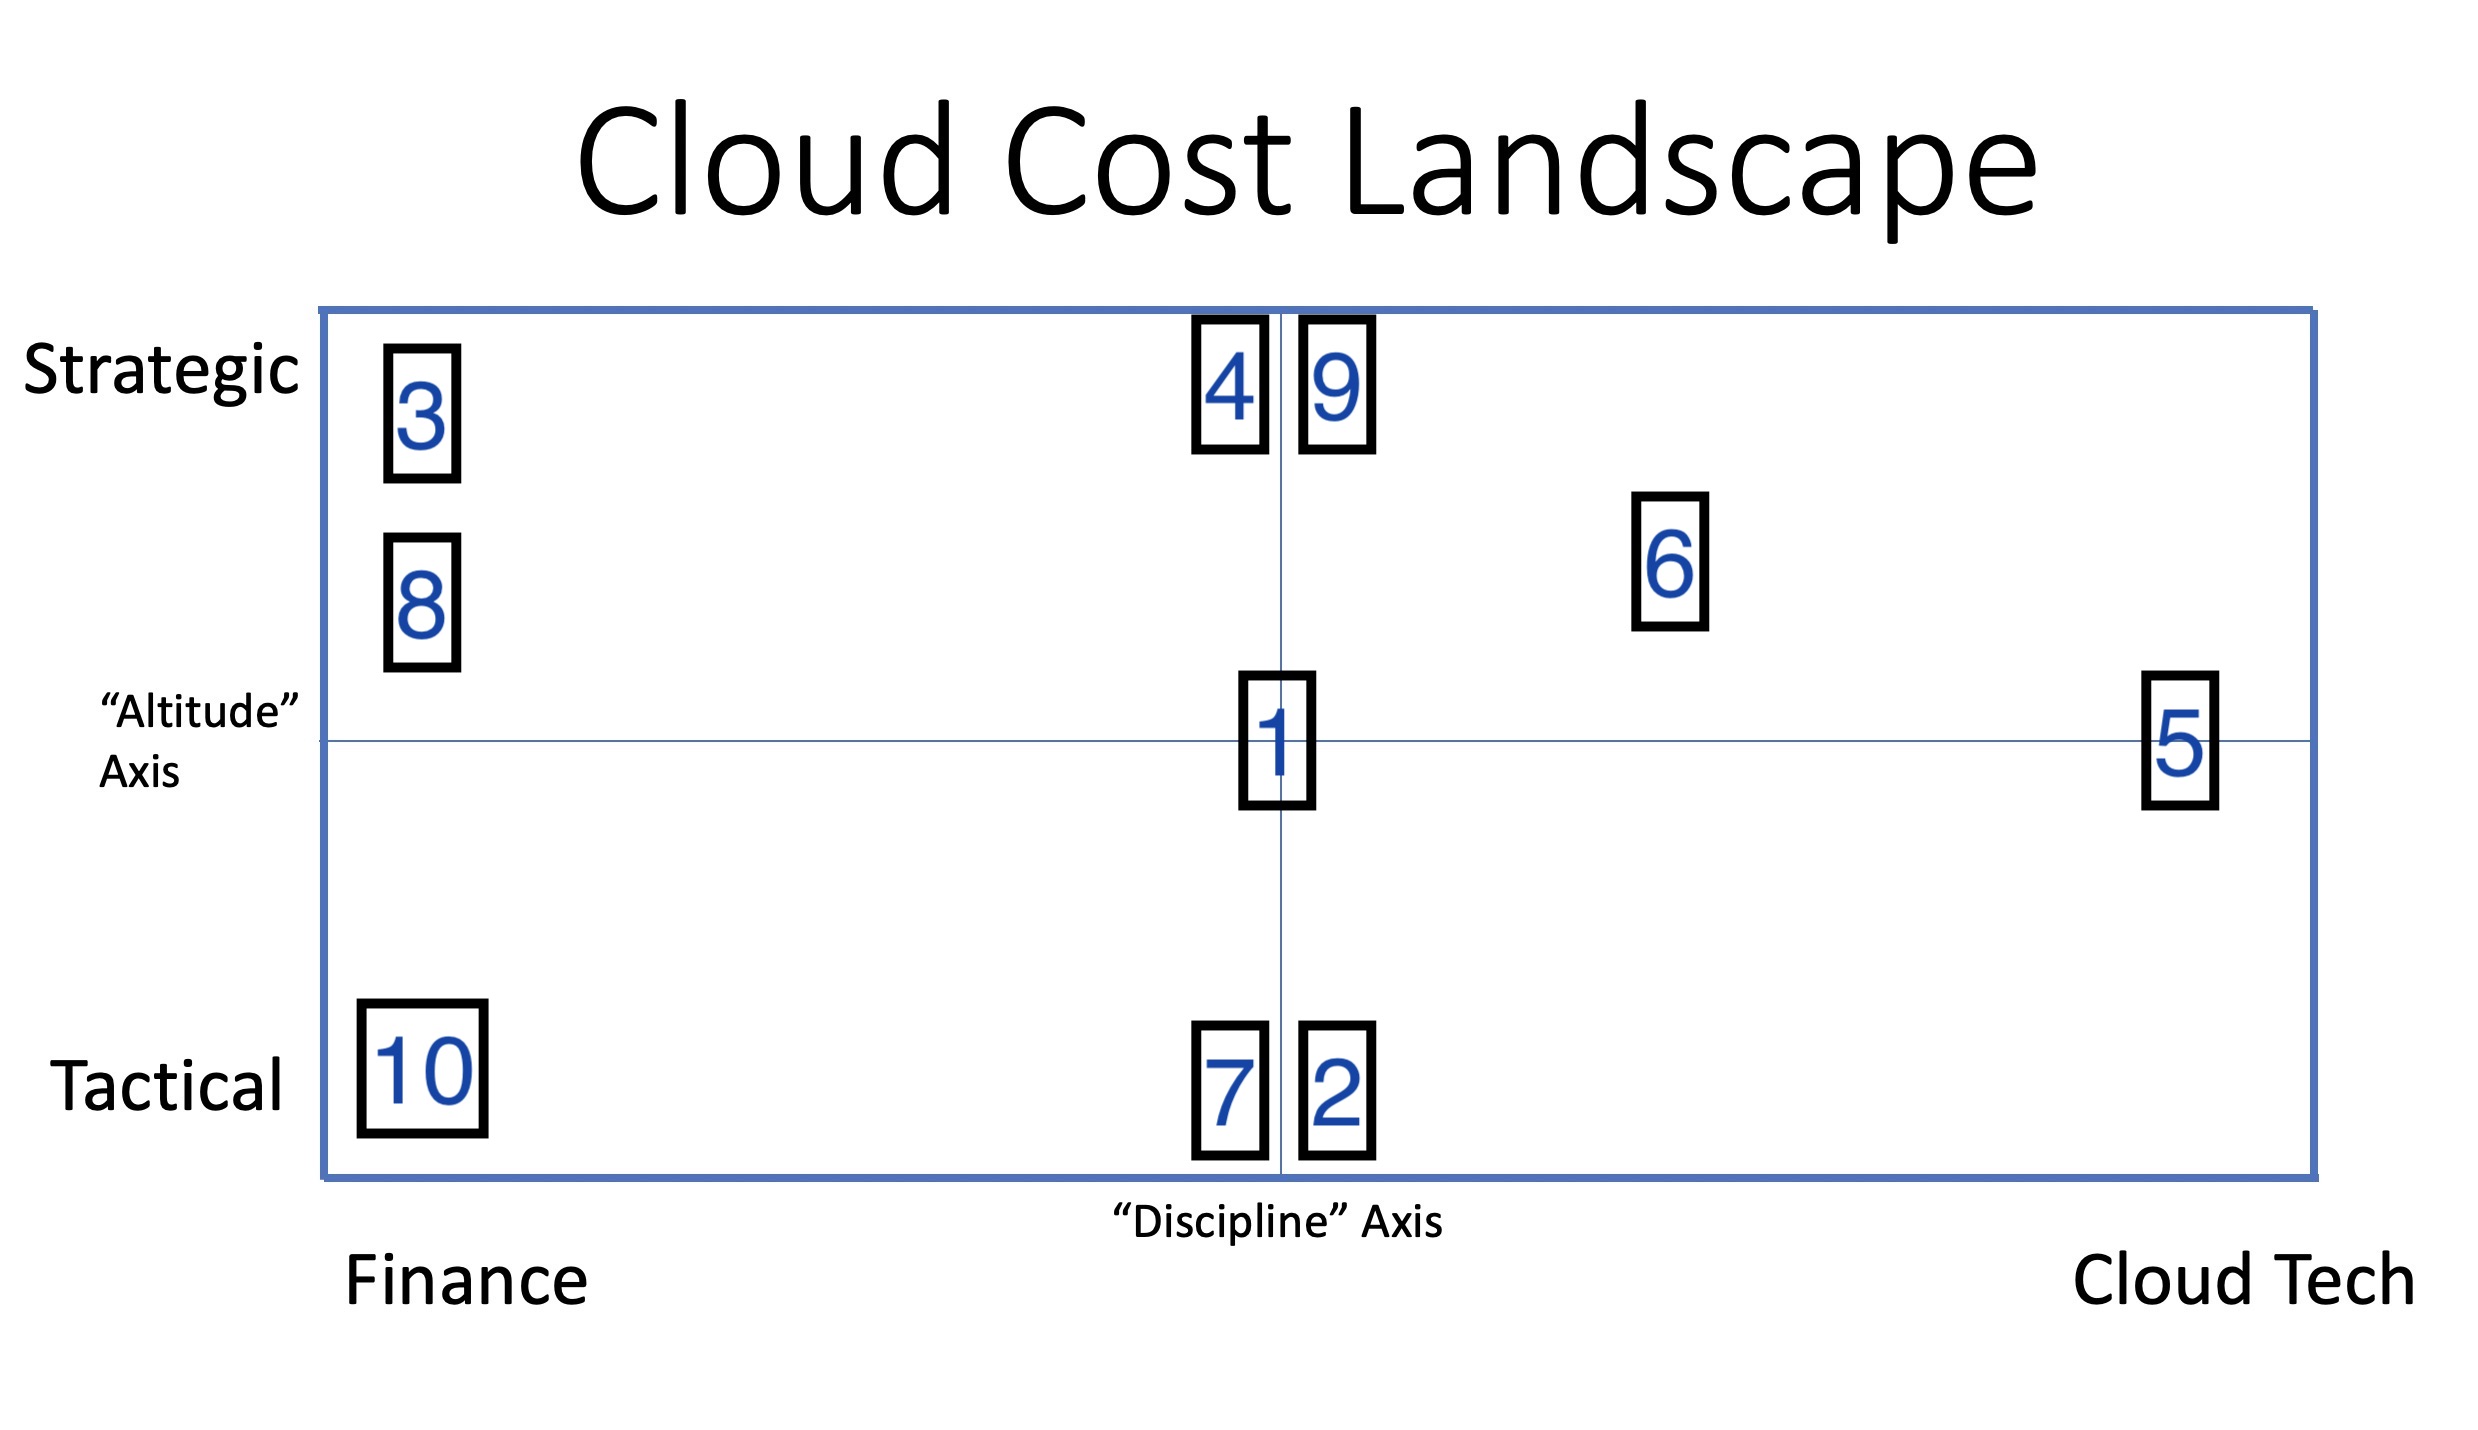
To show how cloud cost management hits us with problems all over the map, here are some challenges likely to be faced by any organization on its cloud journey. This isn’t every challenge to be faced, and those listed might not all be faced on the same day, but they are all problems with non-obvious solutions that your organization will one day have to solve for itself:
How does the arrival of a new prepay product (ex: AWS Savings Plans) affect our prepay rate-lowering strategy?
On average, what was the cost to my organization to run an m5.2xlarge Linux EC2 instance in the us-east-2 region in the 4pm hour yesterday afternoon?
How do our company’s financial objectives influence our prepay strategy for the coming 1-3 years?
Who inside our organization should be managing the cloud vendor relationship and our portfolio of prepaid investments? Should it be centralized or distributed?
How will our transition away from traditional EC2 and into containers affect our usage patterns – and thus our prepay strategy?
How will we hold teams accountable for inefficient operations, even if they still manage to meet their budget?
What prepay investments should we be making RIGHT NOW?
What’s the right way for us to handle the amortization of our prepay investments?
Should we be trying to lock-in with a single cloud vendor, or should we be considering a multi-cloud approach?
How should we handle the $25,000 credit we received on last month’s cloud invoice?
Two key takeaways from this exercise:
The challenges faced by an organization in optimizing its cloud use are “all over the map” and involve a mixture of technical and financial disciplines.
A lot of the key pieces are in their own disciplinary lane in the center of the map. This area represents a distinct body of knowledge and experiences which can be considered a discipline unto itself.
Unless you have persons experienced in this space already on staff, you’ll need to get your Finance folks together with your Cloud/Technology folks to form a cross-functional team to address the challenge. Together, their objective is to build a bridge of knowledge from their disciplines and into what is for your org, the undiscovered world of successful cloud cost management.
One other skillset not called out above but paramount to success – data engineering and analytics. While some large enterprises may have dedicated data teams, most do not, but the cloud is inherently a thoroughly data-driven place. Even for modest-size customers, it is actually a “big data” problem, as one month of detailed cloud costs can easily amount to 100x more than what Excel can handle. To really get to the bottom of your organization’s cloud operation will require the skills to manage and query this data, harvesting it for the value insights it can provide your org in maximizing its outcomes.
In some places this collective discipline might be called “Cloud Cost Optimization”, in others, “Fin Ops”. Whatever the name, it is important to establish and nurture this capability within your organization to ensure it is empowered to make the most of its cloud.
What guides this team in its efforts ?
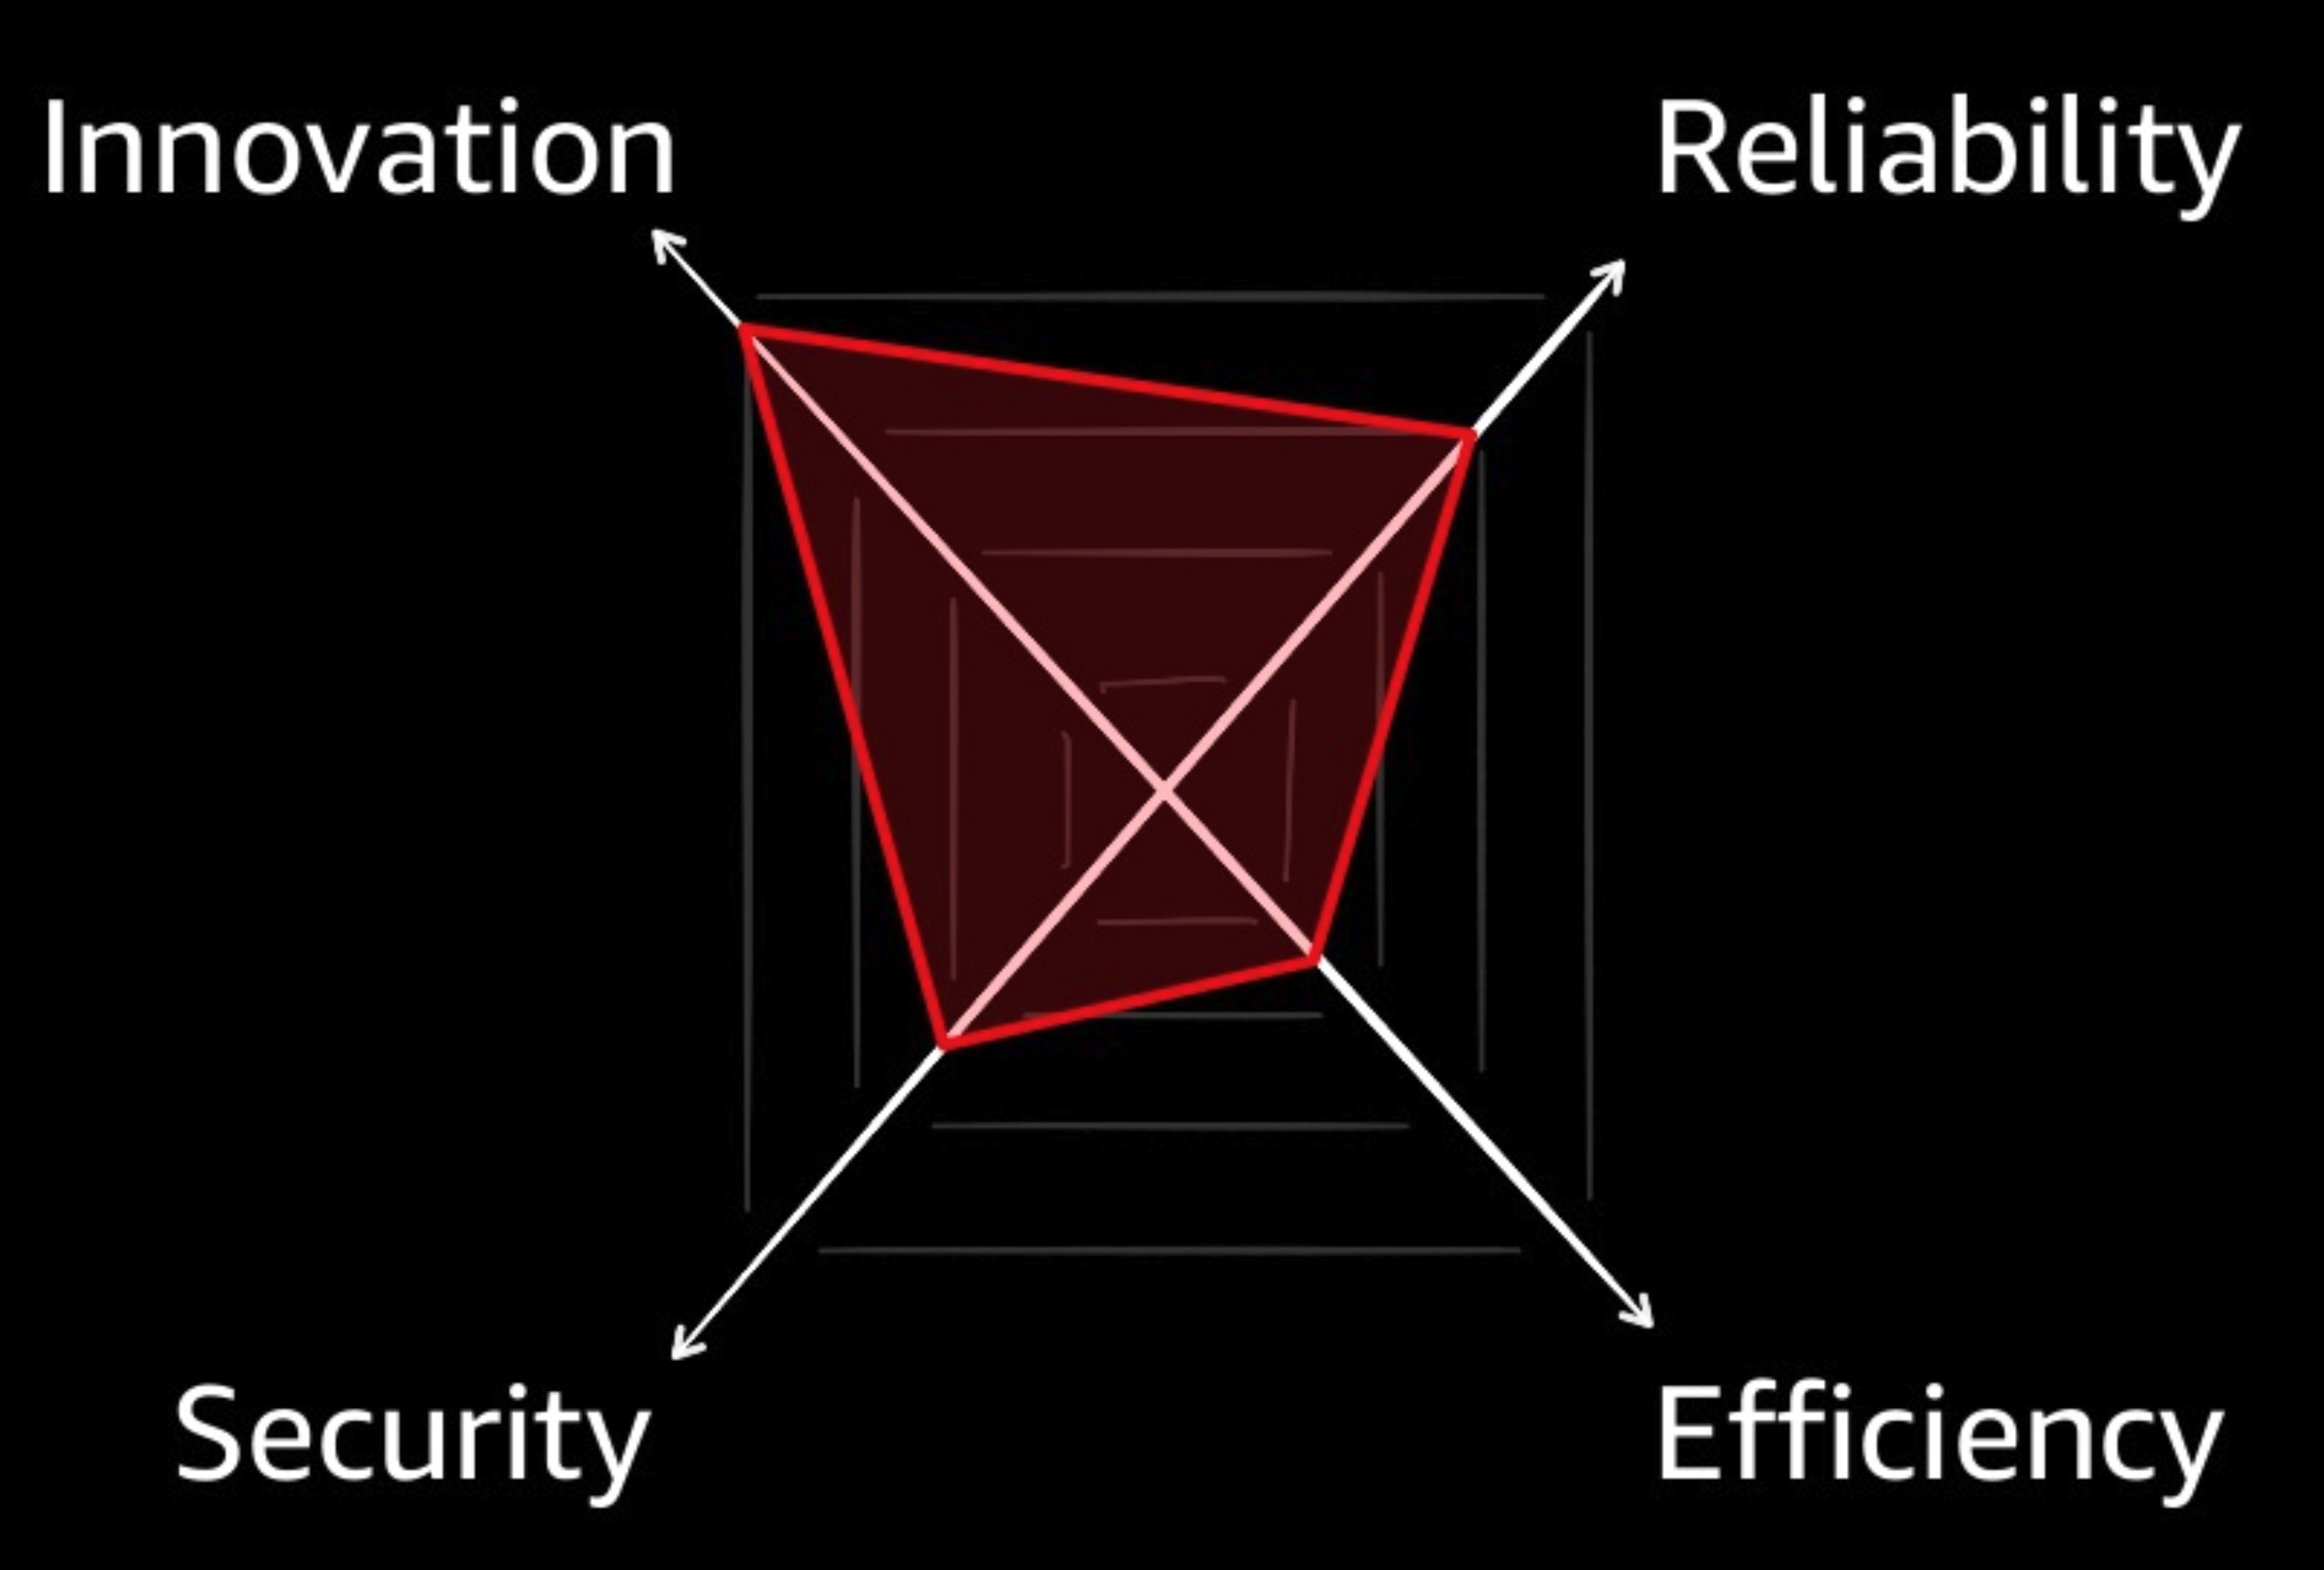
A few years ago Netflix gave a presentation at AWS Re:Invent on their internal approach and tooling to running their cloud efficiently. In the industry, Netflix is one of the most mature and sophisticated organizations in cloud optimization.
Here’s the video replay:
One of the earlier slides is key in illustrating something every cost opt team will have to figure out early on – what’s important to our organization?
Indicative of its maturity, Netflix exhibited a high degree of self-awareness in this image. As a consumer-focused video streaming service, their organization’s focus is on creating and capturing market growth. They recognized how delivering product and service innovations was key to their overall success, and was consciously willing to live with some inefficiencies to make it happen. Recognition of this balance became a compass to the myriad of fork-in-the-road decisions their team made daily.
Of course not everyone is Netflix, and the priorities of a bank, a nonprofit strapped for cash, or a company that makes most of its revenue on just 2-3 days each year, might have different priorities. There is no right or wrong shape to an organization’s priority spread – it’s only wrong to not be conscious of the balance for your org.
Another question to have in mind when looking at the radar graph is, “How good are we at providing for each of these things?” To those watching costs, it might be painful to see new services launched in a wastefully overprovisioned state because time-to-market trumped efficiency-minded engineering experiments. To product managers fighting to deliver for their customers, frustrating to see development teams suffer through weeks of laborious security review processes to release a single change, due to absence of trusted security automation.
Every decision an organization makes in conducting its business impacts the continuous set of tradeoffs being made between these priorities. The initial response to every new business challenge – whether it’s a new regulation, a new piece of technology, or a change in the market – should favor the characteristics most important to your business. Each initial response might come with unsatisfactory impact to other characteristics. It is through focused investment we can minimize the negative effects of these changes over time.
As tempting as it might be to strive for it, there’s no such thing as “being perfect at everything”, and that includes efficiency, the focus of this blog. What’s better, is to be aware of the pros and cons of each decision, and in your role as a champion for efficiency in the org, ensure the best mitigations are put in place to preserve and optimize efficiency in the appropriate balance with the other characteristics.
As shifts occur in the organization’s priorities, it is important too, to be responsive and offer options and solutions to increase efficiency when appetite for a different set of tradeoffs becomes apparent. At the time of this writing (April 2020, in the midst of a global-economy-ravaging pandemic) many companies are re-addressing their prioritizations, and more willing than ever to sacrifice a little bit of innovation, some reliability, and while it’s not always safe to admit it – yes, even some security – in the interest in efficiency gains.
How do we get executive buy-in to invest in the space?
A problem I’ve seen many groups encounter is a difficulty in convincing leadership – particularly those holding for the corporate checkbook – to commit to the resource investments required to really optimize their cloud. While every org and leader is unique, remember the world of cloud cost management and optimization is very deeply data driven. In contrast with other spaces which might be driven more by feel – and where the journey from investment to return can be fuzzy or unconvincing, the data set describing a non-optimized cloud tells a clear and rich story. Real $ opportunities lie right on the surface, no hijinx required to show what is possible.
Think of how hard it is to generate true profit. How many people in sales, marketing, product development, and so on, have to work to secure each new customer? How much is left after the cost of goods sold? Cloud cost optimization offers a path from investment to return that’s faster, simpler, and more certain that just about any other material financial vehicle.
I know of a small, struggling enterprise software company where every million-dollar deal closed shakes the halls from the ensuing celebration. Yet this same company is hesitant to make any financial commitments to cloud use, despite the immediate effects to their corporate profitability being equivalent to closing several of those deals.
Coffee is for … savers?
It’s rare for the path from an investment to its return to be so simple and certain. Yet, because it is so new and unfamiliar to those in traditional Finance or Cloud Ops roles, many cloud customers leave these opportunities on the table.
If the above sounds anything like your situation, the next two installments of this blog will endeavor to arm you with the insights needed to sell your internal org on making the right moves to save big on its cloud spend. Beyond that, I intend to cover several other hot topics I often see as challenges in the industry:
AWS billing and the CUR (Cost and Usage Report) Decoded